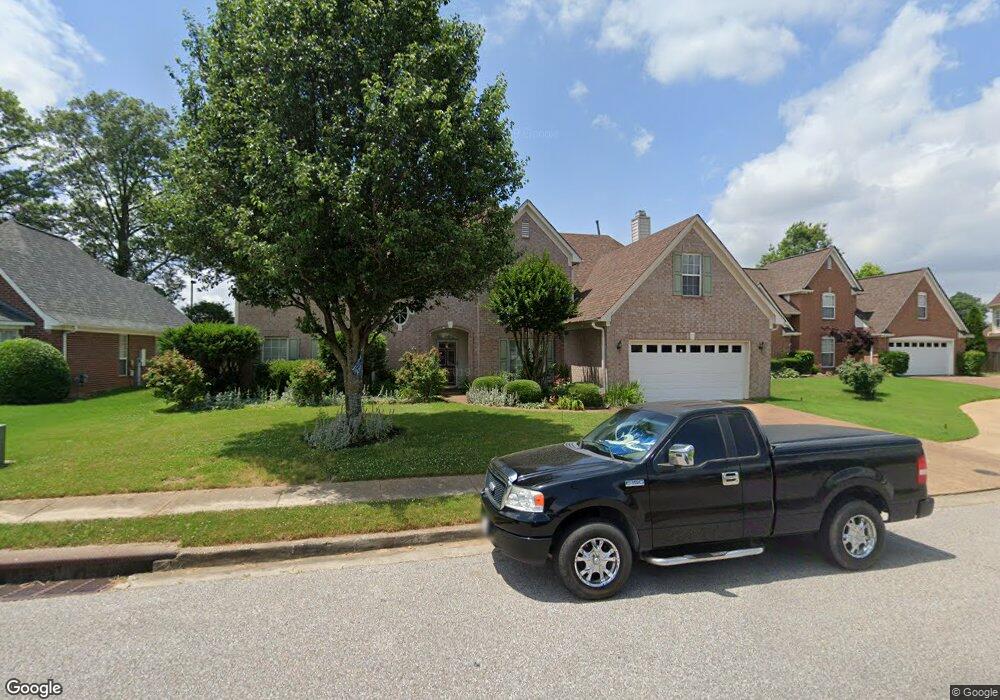
8569 Bay Orchard Ln Cordova, TN 38018
Cordova NeighborhoodEstimated Value: $353,000 - $371,000
4
Beds
4
Baths
3,751
Sq Ft
$96/Sq Ft
Est. Value
About This Home
This home is located at 8569 Bay Orchard Ln, Cordova, TN 38018 and is currently estimated at $361,578, approximately $96 per square foot. 8569 Bay Orchard Ln is a home located in Shelby County with nearby schools including Cordova Elementary School, Cordova Middle School, and Cordova High School.
Ownership History
Date
Name
Owned For
Owner Type
Purchase Details
Closed on
May 8, 2006
Sold by
Jenkins Johnny
Bought by
Jenkins Johnny and Key Jenkins Johnnie
Current Estimated Value
Purchase Details
Closed on
Nov 30, 2005
Sold by
Clifton Christopher A
Bought by
Jenkins Johnny
Home Financials for this Owner
Home Financials are based on the most recent Mortgage that was taken out on this home.
Original Mortgage
$177,520
Outstanding Balance
$108,379
Interest Rate
7.87%
Mortgage Type
Fannie Mae Freddie Mac
Estimated Equity
$253,199
Purchase Details
Closed on
Nov 22, 2005
Sold by
Beare Debbie C Clifton
Bought by
Clifton Christopher A
Home Financials for this Owner
Home Financials are based on the most recent Mortgage that was taken out on this home.
Original Mortgage
$177,520
Outstanding Balance
$108,379
Interest Rate
7.87%
Mortgage Type
Fannie Mae Freddie Mac
Estimated Equity
$253,199
Purchase Details
Closed on
Sep 17, 1999
Sold by
Reid Homes Inc
Bought by
Clifton Christopher A and Clifton Debbie C
Home Financials for this Owner
Home Financials are based on the most recent Mortgage that was taken out on this home.
Original Mortgage
$180,950
Interest Rate
7.89%
Create a Home Valuation Report for This Property
The Home Valuation Report is an in-depth analysis detailing your home's value as well as a comparison with similar homes in the area
Home Values in the Area
Average Home Value in this Area
Purchase History
| Date | Buyer | Sale Price | Title Company |
|---|---|---|---|
| Jenkins Johnny | -- | Realty Title & Escrow Co Inc | |
| Jenkins Johnny | $221,900 | Realty Title & Escrow Co | |
| Clifton Christopher A | -- | Realty Title & Escrow Co | |
| Clifton Christopher A | $234,500 | West Tennessee Title |
Source: Public Records
Mortgage History
| Date | Status | Borrower | Loan Amount |
|---|---|---|---|
| Open | Jenkins Johnny | $177,520 | |
| Previous Owner | Clifton Christopher A | $180,950 |
Source: Public Records
Tax History Compared to Growth
Tax History
| Year | Tax Paid | Tax Assessment Tax Assessment Total Assessment is a certain percentage of the fair market value that is determined by local assessors to be the total taxable value of land and additions on the property. | Land | Improvement |
|---|---|---|---|---|
| 2025 | $2,251 | $86,850 | $18,000 | $68,850 |
| 2024 | $2,267 | $66,875 | $12,725 | $54,150 |
| 2023 | $4,074 | $66,875 | $12,725 | $54,150 |
| 2022 | $4,074 | $66,875 | $12,725 | $54,150 |
| 2021 | $4,122 | $66,875 | $12,725 | $54,150 |
| 2020 | $3,451 | $47,625 | $12,725 | $34,900 |
| 2019 | $3,451 | $47,625 | $12,725 | $34,900 |
| 2018 | $3,451 | $47,625 | $12,725 | $34,900 |
| 2017 | $1,957 | $47,625 | $12,725 | $34,900 |
| 2016 | $1,967 | $45,000 | $0 | $0 |
| 2014 | $1,967 | $45,000 | $0 | $0 |
Source: Public Records
Map
Nearby Homes
- 8463 Stoksund Cove
- 8416 W Askersund Cove
- 11 W Viking Dr
- 283 Walnut Tree Cove
- 8365 Cedar Bend Cove
- 8682 Spice Wood Ln
- 8579 Ericson Cove
- 0 Chelsea Meadow Lot 40 Cove Unit 10005859
- 167 Ericson Rd
- 90 W Viking Dr
- 178 Mysen Cir
- 334 Brook Ridge Dr
- 179 Mysen Cir
- 470 Walnut Point Cove
- 00 Walnut Grove Rd
- 8544 Woodcock Cove
- 8874 Walnut Ridge Loop
- 196 Rhonda Cir E
- 8225 Walnut Grove Rd
- 8228 Planters Grove Dr
- 8573 Bay Orchard Ln
- 8565 Bay Orchard Ln
- 8577 Bay Orchard Ln
- 8564 Bay Orchard Ln
- 8561 Bay Orchard Ln
- 8574 Bay Orchard Ln
- 8557 Bay Orchard Ln
- 8578 Bay Orchard Ln
- 8581 Bay Orchard Ln
- 8553 Bay Orchard Ln
- 8571 May Orchard Ln
- 8582 Bay Orchard Ln
- 8549 Bay Orchard Ln
- 8585 Bay Orchard Ln
- 8589 May Orchard Ln
- 8586 Bay Orchard Ln
- 291 Bay Orchard Cove
- 8593 May Orchard Ln
- 8589 Bay Orchard Ln
- 8570 May Orchard Ln