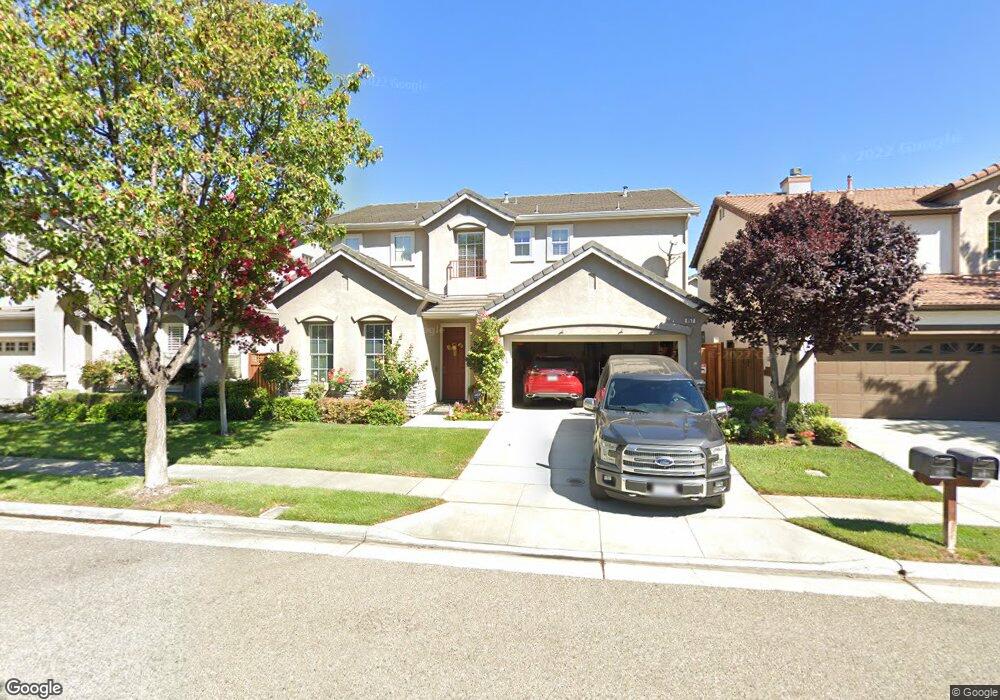
857 Dederick Ct San Jose, CA 95125
South San Jose NeighborhoodEstimated Value: $1,881,000 - $1,981,000
4
Beds
3
Baths
2,429
Sq Ft
$804/Sq Ft
Est. Value
About This Home
This home is located at 857 Dederick Ct, San Jose, CA 95125 and is currently estimated at $1,953,987, approximately $804 per square foot. 857 Dederick Ct is a home located in Santa Clara County with nearby schools including Canoas Elementary School, John Muir Middle School, and Gunderson High School.
Ownership History
Date
Name
Owned For
Owner Type
Purchase Details
Closed on
May 20, 2005
Sold by
Baker Kenneth Richard and Baker Joanne
Bought by
Baker Kenneth R and Baker Joanne
Current Estimated Value
Purchase Details
Closed on
Jul 6, 1999
Sold by
Kaufman & Broad South Bay Inc
Bought by
Baker Kenneth Richard and Baker Joanne
Home Financials for this Owner
Home Financials are based on the most recent Mortgage that was taken out on this home.
Original Mortgage
$240,000
Outstanding Balance
$67,651
Interest Rate
7.64%
Estimated Equity
$1,886,336
Create a Home Valuation Report for This Property
The Home Valuation Report is an in-depth analysis detailing your home's value as well as a comparison with similar homes in the area
Home Values in the Area
Average Home Value in this Area
Purchase History
| Date | Buyer | Sale Price | Title Company |
|---|---|---|---|
| Baker Kenneth R | -- | -- | |
| Baker Kenneth Richard | $501,000 | First American Title Guarant |
Source: Public Records
Mortgage History
| Date | Status | Borrower | Loan Amount |
|---|---|---|---|
| Open | Baker Kenneth Richard | $240,000 |
Source: Public Records
Tax History Compared to Growth
Tax History
| Year | Tax Paid | Tax Assessment Tax Assessment Total Assessment is a certain percentage of the fair market value that is determined by local assessors to be the total taxable value of land and additions on the property. | Land | Improvement |
|---|---|---|---|---|
| 2025 | $10,252 | $769,699 | $353,495 | $416,204 |
| 2024 | $10,252 | $754,608 | $346,564 | $408,044 |
| 2023 | $10,044 | $739,813 | $339,769 | $400,044 |
| 2022 | $9,945 | $725,307 | $333,107 | $392,200 |
| 2021 | $9,723 | $711,086 | $326,576 | $384,510 |
| 2020 | $9,492 | $703,796 | $323,228 | $380,568 |
| 2019 | $9,281 | $689,997 | $316,891 | $373,106 |
| 2018 | $9,123 | $676,469 | $310,678 | $365,791 |
| 2017 | $9,045 | $663,206 | $304,587 | $358,619 |
| 2016 | $8,867 | $650,203 | $298,615 | $351,588 |
| 2015 | $8,805 | $640,437 | $294,130 | $346,307 |
| 2014 | $8,354 | $627,893 | $288,369 | $339,524 |
Source: Public Records
Map
Nearby Homes
- 817 Pitkin Loop
- 2871 Rubino Cir
- 2829 Rubino Cir
- 903 Lanewood Dr
- 3048 Brunetti Way Unit 47
- 3074 Pearl Ave
- 921 Kingfisher Dr
- 2633 Villa Cortona Way Unit E1
- 3066 Nattinger Ln
- 707 Mill Stream Dr Unit 707
- 707 Mill Stream Dr
- 259 Mountain Springs Dr Unit 259
- 255 Mountain Springs Dr
- 149 Mountain Springs Dr Unit 149
- 1202 Foxworthy Ave
- 1027 Shenandoah Dr
- 120 Mountain Springs Dr Unit 120
- 532A Mill Pond Dr Unit 532 A
- 375 Mill Pond Dr Unit 375
- 3072 Mary Helen Ln
- 851 Dederick Ct
- 863 Dederick Ct
- 808 Pitkin Loop
- 804 Pitkin Loop
- 812 Pitkin Loop
- 845 Dederick Ct
- 869 Dederick Ct
- 816 Pitkin Loop
- 800 Pitkin Loop
- 850 Dederick Ct
- 862 Dederick Ct
- 839 Dederick Ct
- 844 Dederick Ct
- 868 Dederick Ct
- 820 Pitkin Loop
- 838 Dederick Ct
- 833 Dederick Ct
- 809 Pitkin Loop
- 853 Romani Ct
- 824 Pitkin Loop