Estimated Value: $709,330 - $816,000
3
Beds
2
Baths
4,233
Sq Ft
$178/Sq Ft
Est. Value
About This Home
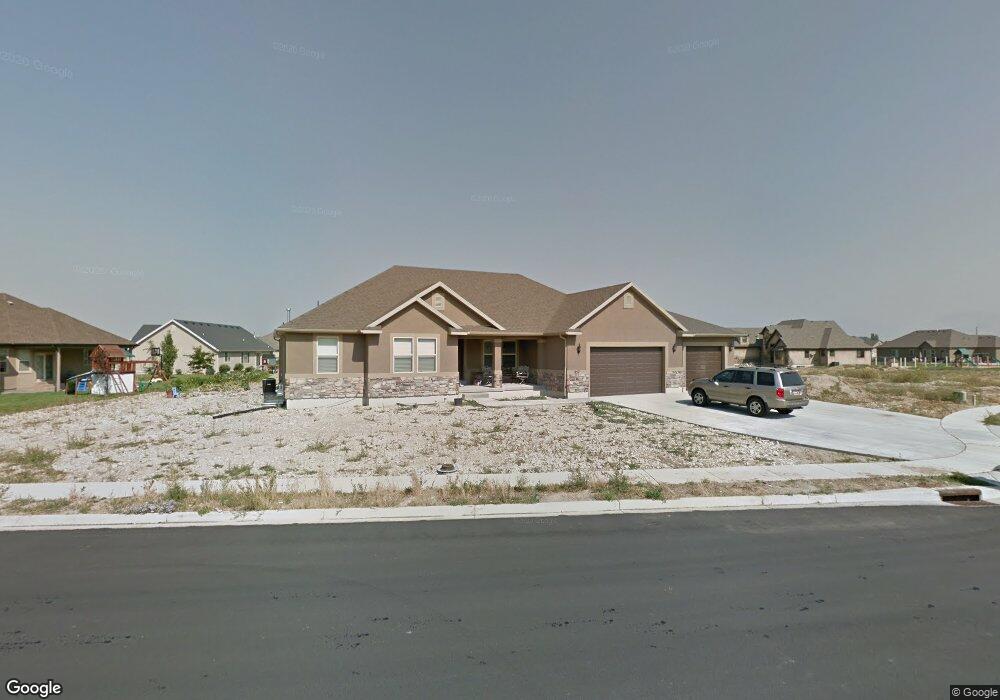
This home is located at 857 E 540 S Unit 5, Salem, UT 84653 and is currently estimated at $754,110, approximately $178 per square foot. 857 E 540 S Unit 5 is a home located in Utah County with nearby schools including Foothills Elementary School, Valley View Middle School, and Salem Junior High School.
Ownership History
Date
Name
Owned For
Owner Type
Purchase Details
Closed on
Mar 23, 2012
Sold by
12Llc Edge Land
Bought by
Johnso Dennis Lee
Current Estimated Value
Purchase Details
Closed on
Dec 19, 2011
Sold by
Rock Canyon Bank
Bought by
Edge Land 12 Llc
Purchase Details
Closed on
Aug 23, 2011
Sold by
Silver Ridge Llc
Bought by
Rock Canyon Bank
Create a Home Valuation Report for This Property
The Home Valuation Report is an in-depth analysis detailing your home's value as well as a comparison with similar homes in the area
Home Values in the Area
Average Home Value in this Area
Purchase History
| Date | Buyer | Sale Price | Title Company |
|---|---|---|---|
| Johnso Dennis Lee | -- | None Available | |
| Johnson Dennis Lee | -- | None Available | |
| Edge Land 12 Llc | -- | Affiliated First Title Compa | |
| Rock Canyon Bank | -- | None Available |
Source: Public Records
Tax History
| Year | Tax Paid | Tax Assessment Tax Assessment Total Assessment is a certain percentage of the fair market value that is determined by local assessors to be the total taxable value of land and additions on the property. | Land | Improvement |
|---|---|---|---|---|
| 2025 | $1,803 | $372,900 | -- | -- |
| 2024 | $1,803 | $334,510 | $0 | $0 |
| 2023 | $1,917 | $338,635 | $0 | $0 |
| 2022 | $3,036 | $388,850 | $0 | $0 |
| 2021 | $2,125 | $491,500 | $138,500 | $353,000 |
| 2020 | $2,073 | $472,000 | $125,900 | $346,100 |
| 2019 | $2,652 | $423,000 | $116,300 | $306,700 |
| 2018 | $2,775 | $423,000 | $116,300 | $306,700 |
| 2017 | $2,472 | $200,970 | $0 | $0 |
| 2016 | $2,376 | $190,905 | $0 | $0 |
| 2015 | $2,335 | $184,305 | $0 | $0 |
| 2014 | $2,270 | $179,465 | $0 | $0 |
Source: Public Records
Map
Nearby Homes
- 1026 E 310 S
- 1003 E 310 S Unit 11
- 1036 E 310 S
- 1018 E 250 S
- 1034 E 250 S
- 9800 Woodland Hills Dr
- 180 Woodland Hills Dr
- 1001 E 250 S
- 1033 E 250 S
- 881 E 820 S
- 1939 E Dorset Way Unit 306
- 1965 E Dorset Way Unit 303
- 1558 E 1010 N Unit 203
- 1984 E Dorset Way Unit 279
- 1802 E Albion Dr Unit 1142
- 1962 E Dorset Way Unit 276
- 1968 E Dorset Way Unit 277
- 173 E 10000 S
- 88 S 850 E
- 797 S 500 E Unit 12
Your Personal Tour Guide
Ask me questions while you tour the home.