Estimated Value: $121,000 - $148,000
Studio
2
Baths
1,472
Sq Ft
$90/Sq Ft
Est. Value
About This Home
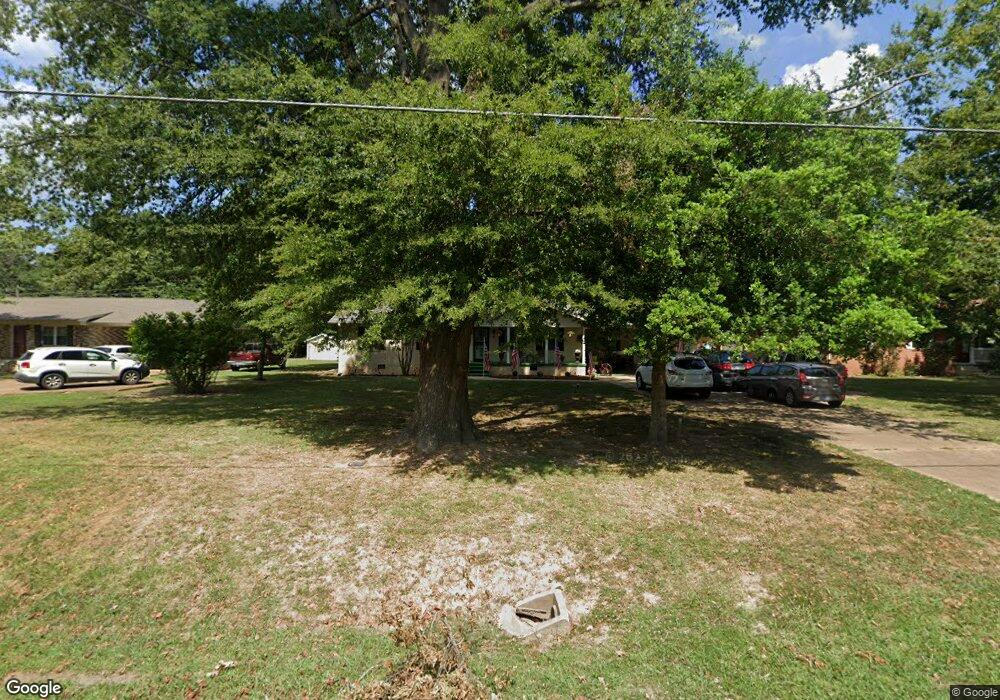
This home is located at 857 N Main St, Dyer, TN 38330 and is currently estimated at $131,931, approximately $89 per square foot. 857 N Main St is a home located in Gibson County with nearby schools including Dyer Elementary School and Gibson County High School.
Ownership History
Date
Name
Owned For
Owner Type
Purchase Details
Closed on
Mar 14, 2022
Sold by
Jeff Harrison
Bought by
Carter Farra and Carter Carl
Current Estimated Value
Home Financials for this Owner
Home Financials are based on the most recent Mortgage that was taken out on this home.
Original Mortgage
$101,010
Outstanding Balance
$94,207
Interest Rate
3.92%
Mortgage Type
New Conventional
Estimated Equity
$37,724
Purchase Details
Closed on
Feb 21, 1974
Bought by
Judy Finis and Judy Mary D
Purchase Details
Closed on
Jul 22, 1969
Create a Home Valuation Report for This Property
The Home Valuation Report is an in-depth analysis detailing your home's value as well as a comparison with similar homes in the area
Purchase History
| Date | Buyer | Sale Price | Title Company |
|---|---|---|---|
| Carter Farra | $100,000 | New Title Company Name | |
| Judy Finis | -- | -- | |
| -- | -- | -- |
Source: Public Records
Mortgage History
| Date | Status | Borrower | Loan Amount |
|---|---|---|---|
| Open | Carter Farra | $101,010 |
Source: Public Records
Tax History
| Year | Tax Paid | Tax Assessment Tax Assessment Total Assessment is a certain percentage of the fair market value that is determined by local assessors to be the total taxable value of land and additions on the property. | Land | Improvement |
|---|---|---|---|---|
| 2025 | $1,114 | $30,800 | $3,500 | $27,300 |
| 2024 | $1,067 | $30,800 | $3,500 | $27,300 |
| 2023 | $589 | $18,925 | $2,025 | $16,900 |
| 2022 | $575 | $18,925 | $2,025 | $16,900 |
| 2021 | $489 | $16,050 | $2,025 | $14,025 |
| 2020 | $799 | $16,050 | $2,025 | $14,025 |
| 2019 | $798 | $16,050 | $2,025 | $14,025 |
| 2018 | $842 | $16,650 | $2,025 | $14,625 |
| 2017 | $808 | $16,650 | $2,025 | $14,625 |
| 2016 | $808 | $16,650 | $2,025 | $14,625 |
| 2015 | $735 | $16,650 | $2,025 | $14,625 |
| 2014 | $730 | $16,525 | $2,025 | $14,500 |
Source: Public Records
Map
Nearby Homes
- 205 Division St
- 208 & 210 Lee St
- 23 Gravettes Crossing Rd W
- 295 E College St
- 403 E College St
- 115 High St
- 139 Peach St
- 354 E Maple St
- 508 E College St
- 299 E Walnut St
- 303 E Walnut St
- 217 Central St
- 342 E Walnut St
- 163 Monroe St
- 226 Madison St
- 246 Thomas St
- 298 High St
- 314 New Hope Rd
- 404 Callis Dr
- 148 Scattered Acres Loop
Your Personal Tour Guide
Ask me questions while you tour the home.