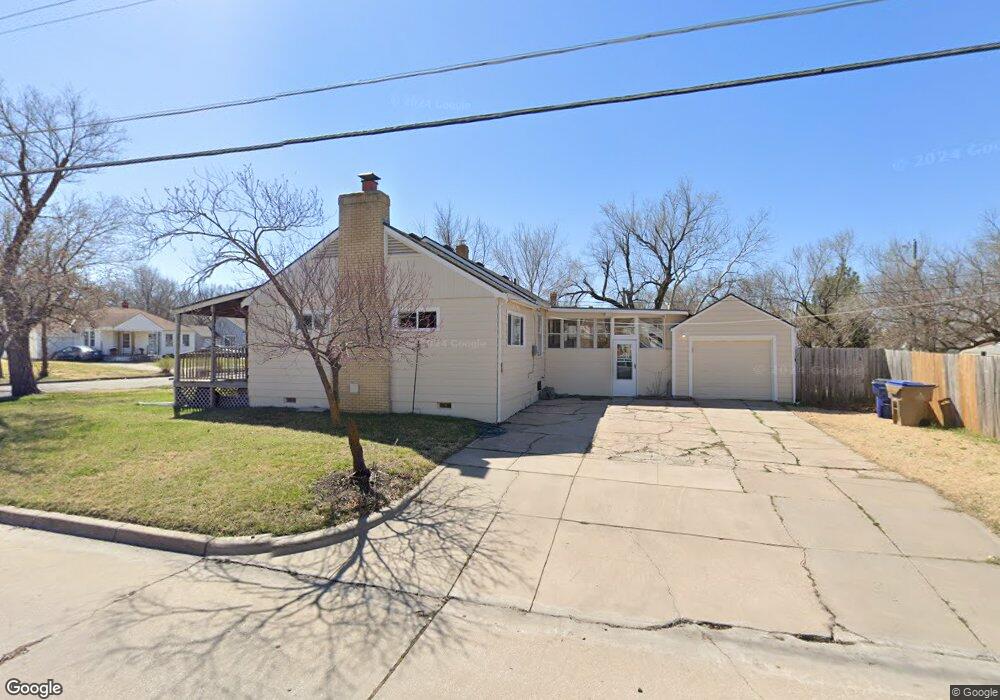
857 N Pinecrest St Wichita, KS 67208
New Day NeighborhoodEstimated Value: $149,429 - $155,000
3
Beds
1
Bath
1,642
Sq Ft
$93/Sq Ft
Est. Value
About This Home
This home is located at 857 N Pinecrest St, Wichita, KS 67208 and is currently estimated at $152,215, approximately $92 per square foot. 857 N Pinecrest St is a home located in Sedgwick County with nearby schools including Adams Elementary School, Robinson Middle School, and Wichita High School East.
Ownership History
Date
Name
Owned For
Owner Type
Purchase Details
Closed on
Jun 2, 2021
Sold by
Akm Properties Llc
Bought by
Brinegar Louise F and Carr Herbert E
Current Estimated Value
Home Financials for this Owner
Home Financials are based on the most recent Mortgage that was taken out on this home.
Original Mortgage
$61,850
Outstanding Balance
$46,650
Interest Rate
2.9%
Mortgage Type
New Conventional
Estimated Equity
$105,565
Purchase Details
Closed on
Dec 5, 2011
Sold by
American Equity Funding Inc
Bought by
Mohr Timothy A and Mohr Ann K
Purchase Details
Closed on
Oct 15, 2011
Sold by
Deutsche Bank National Trust Company
Bought by
American Equity Funding Inc
Purchase Details
Closed on
Jun 9, 2011
Sold by
Lighthouse Properties Of Wichita
Bought by
Deutsche Bank National Trust Co
Purchase Details
Closed on
Jan 3, 2011
Sold by
Walker Dawn and Dreiling Dawn
Bought by
Lighthouse Properties Of Wichita Llc
Purchase Details
Closed on
Apr 28, 2006
Sold by
Farrar Regina B
Bought by
Drelling Dawn
Create a Home Valuation Report for This Property
The Home Valuation Report is an in-depth analysis detailing your home's value as well as a comparison with similar homes in the area
Home Values in the Area
Average Home Value in this Area
Purchase History
| Date | Buyer | Sale Price | Title Company |
|---|---|---|---|
| Brinegar Louise F | -- | Security 1St Title Llc | |
| Mohr Timothy A | -- | Security 1St | |
| American Equity Funding Inc | -- | None Available | |
| Deutsche Bank National Trust Co | -- | None Available | |
| Lighthouse Properties Of Wichita Llc | -- | None Available | |
| Drelling Dawn | -- | None Available |
Source: Public Records
Mortgage History
| Date | Status | Borrower | Loan Amount |
|---|---|---|---|
| Open | Brinegar Louise F | $61,850 |
Source: Public Records
Tax History Compared to Growth
Tax History
| Year | Tax Paid | Tax Assessment Tax Assessment Total Assessment is a certain percentage of the fair market value that is determined by local assessors to be the total taxable value of land and additions on the property. | Land | Improvement |
|---|---|---|---|---|
| 2025 | $1,074 | $11,914 | $2,323 | $9,591 |
| 2023 | $1,074 | $9,867 | $1,564 | $8,303 |
| 2022 | $976 | $9,201 | $1,484 | $7,717 |
| 2021 | $1,213 | $10,776 | $1,484 | $9,292 |
| 2020 | $1,013 | $9,017 | $1,484 | $7,533 |
| 2019 | $965 | $8,591 | $1,484 | $7,107 |
| 2018 | $928 | $8,258 | $1,162 | $7,096 |
| 2017 | $1,001 | $0 | $0 | $0 |
| 2016 | $985 | $0 | $0 | $0 |
| 2015 | $1,008 | $0 | $0 | $0 |
| 2014 | $1,020 | $0 | $0 | $0 |
Source: Public Records
Map
Nearby Homes
- 916 & 918 N Glendale
- 924 & 926 N Glendale
- 4907 E Murdock St
- 1002 N Parkwood Ln
- 630 N Old Manor Rd
- 815 N Oliver Ave
- 5204 Plaza Ln
- 1032 N Christine St
- 1128 N Dellrose St
- 421 N Harding Ave
- 5212 E 3rd St N
- 414 N Bleckley Dr
- 1181 N Pinecrest St
- 930 N Crestway Ave
- 1123 N Pershing St
- 5109 E 3rd St N
- 425 N Dellrose Ave
- 808 N Belmont Ave
- 337 N Parkwood Ln
- 331 N Coronado Place
- 851 N Pinecrest St
- 903 N Pinecrest St
- 845 N Pinecrest St
- 856 N Pinecrest St
- 850 N Pinecrest St
- 846 N Battin St
- 840 N Battin St
- 909 N Pinecrest St
- 839 N Pinecrest St
- 902 N Pinecrest St
- 844 N Pinecrest St
- 836 N Battin St
- 904 N Battin St
- 838 N Pinecrest St
- 908 N Pinecrest St
- 833 N Pinecrest St
- 915 N Pinecrest St
- 830 N Battin St
- 910 N Battin St
- 826 N Battin St