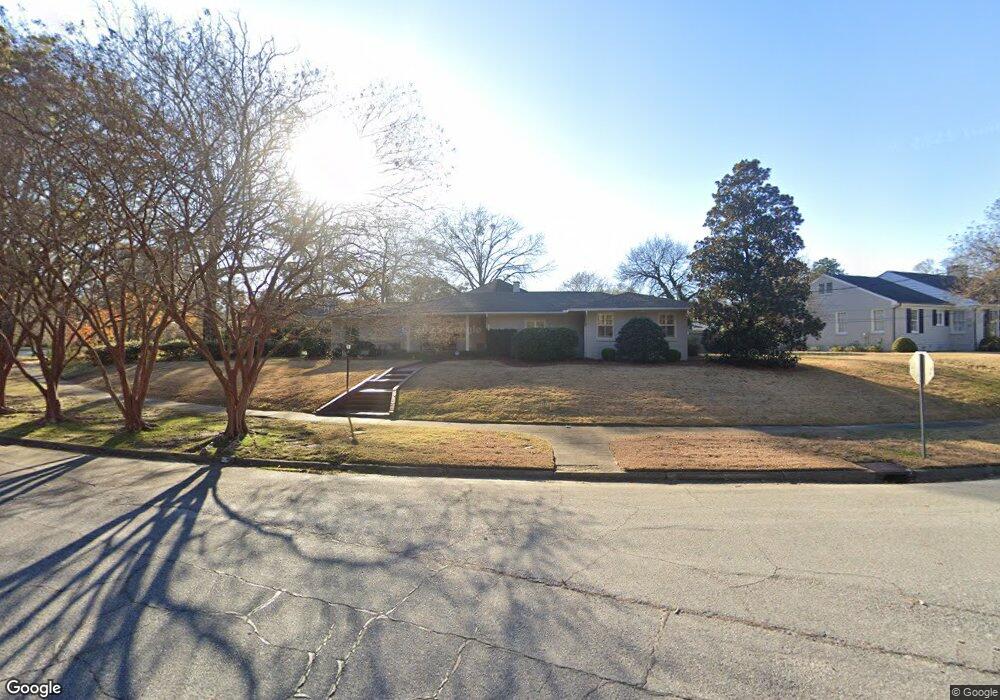
857 Overlook Dr Columbus, GA 31906
Wynns Hill NeighborhoodEstimated Value: $492,326 - $520,000
4
Beds
3
Baths
3,536
Sq Ft
$142/Sq Ft
Est. Value
About This Home
This home is located at 857 Overlook Dr, Columbus, GA 31906 and is currently estimated at $502,332, approximately $142 per square foot. 857 Overlook Dr is a home located in Muscogee County with nearby schools including Baker Middle School, Jordan Vocational High School, and Wynnton Elementary School.
Ownership History
Date
Name
Owned For
Owner Type
Purchase Details
Closed on
Dec 3, 2019
Sold by
Kratz Samuel J
Bought by
Downs Timothy R and Downs Catherine V
Current Estimated Value
Home Financials for this Owner
Home Financials are based on the most recent Mortgage that was taken out on this home.
Original Mortgage
$248,000
Outstanding Balance
$218,648
Interest Rate
3.6%
Mortgage Type
New Conventional
Estimated Equity
$283,684
Purchase Details
Closed on
Dec 5, 2017
Sold by
Gullett Gary G
Bought by
Kratz Samuel J and Kratz Pari
Home Financials for this Owner
Home Financials are based on the most recent Mortgage that was taken out on this home.
Original Mortgage
$149,000
Interest Rate
3.9%
Mortgage Type
New Conventional
Purchase Details
Closed on
Dec 20, 2012
Sold by
Gullett Gary G
Bought by
Powers Corcoran Jocelyn
Create a Home Valuation Report for This Property
The Home Valuation Report is an in-depth analysis detailing your home's value as well as a comparison with similar homes in the area
Home Values in the Area
Average Home Value in this Area
Purchase History
| Date | Buyer | Sale Price | Title Company |
|---|---|---|---|
| Downs Timothy R | $310,000 | -- | |
| Kratz Samuel J | $334,000 | -- | |
| Powers Corcoran Jocelyn | -- | -- |
Source: Public Records
Mortgage History
| Date | Status | Borrower | Loan Amount |
|---|---|---|---|
| Open | Downs Timothy R | $248,000 | |
| Previous Owner | Kratz Samuel J | $149,000 |
Source: Public Records
Tax History Compared to Growth
Tax History
| Year | Tax Paid | Tax Assessment Tax Assessment Total Assessment is a certain percentage of the fair market value that is determined by local assessors to be the total taxable value of land and additions on the property. | Land | Improvement |
|---|---|---|---|---|
| 2025 | $4,416 | $144,572 | $21,132 | $123,440 |
| 2024 | $4,415 | $144,572 | $21,132 | $123,440 |
| 2023 | $3,749 | $144,572 | $21,132 | $123,440 |
| 2022 | $4,605 | $118,840 | $21,132 | $97,708 |
| 2021 | $4,598 | $126,000 | $21,132 | $104,868 |
| 2020 | $5,064 | $124,000 | $20,920 | $103,080 |
| 2019 | $4,237 | $116,756 | $21,132 | $95,624 |
| 2018 | $4,237 | $116,756 | $21,132 | $95,624 |
| 2017 | $4,799 | $116,756 | $21,132 | $95,624 |
| 2016 | $5,832 | $154,650 | $16,633 | $138,017 |
| 2015 | $5,840 | $154,650 | $16,633 | $138,017 |
| 2014 | $5,797 | $154,650 | $16,633 | $138,017 |
| 2013 | -- | $154,650 | $16,633 | $138,017 |
Source: Public Records
Map
Nearby Homes