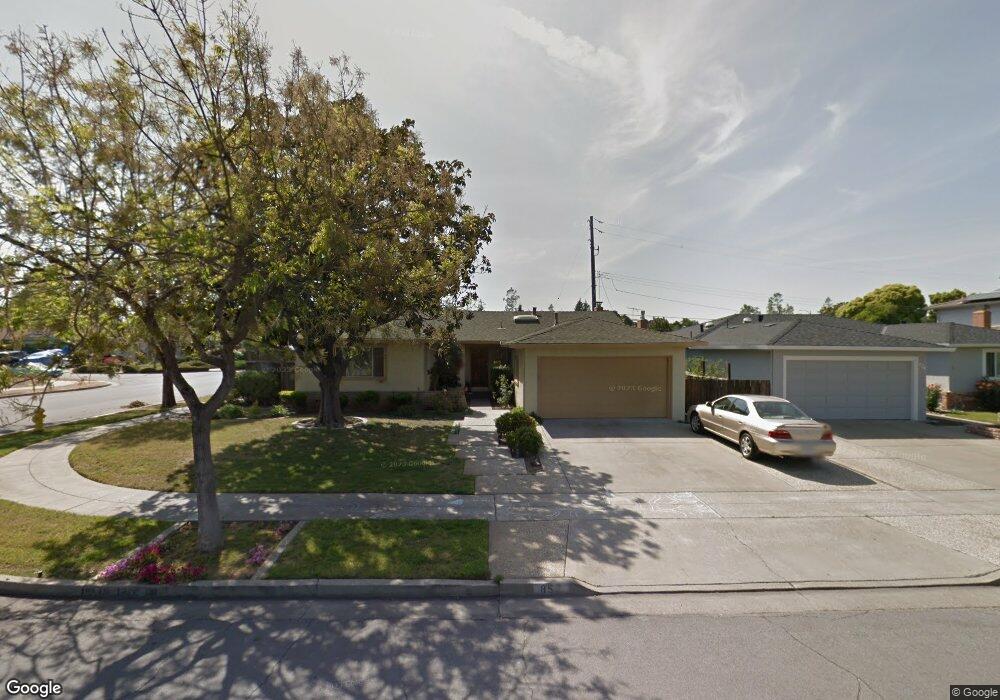
857 Raintree Dr Unit 1 San Jose, CA 95129
Strawberry Park NeighborhoodEstimated Value: $2,734,000 - $2,893,000
4
Beds
2
Baths
1,976
Sq Ft
$1,419/Sq Ft
Est. Value
About This Home
This home is located at 857 Raintree Dr Unit 1, San Jose, CA 95129 and is currently estimated at $2,803,966, approximately $1,419 per square foot. 857 Raintree Dr Unit 1 is a home located in Santa Clara County with nearby schools including Manuel De Vargas Elementary School, Warren E. Hyde Middle School, and Cupertino High School.
Ownership History
Date
Name
Owned For
Owner Type
Purchase Details
Closed on
Jan 18, 2011
Sold by
Calderone Terrence J and Calderone Denise M
Bought by
Ganu Sunil and Ganu Swati
Current Estimated Value
Home Financials for this Owner
Home Financials are based on the most recent Mortgage that was taken out on this home.
Original Mortgage
$686,800
Outstanding Balance
$432,676
Interest Rate
3.25%
Mortgage Type
FHA
Estimated Equity
$2,371,290
Purchase Details
Closed on
Aug 15, 2006
Sold by
Banducci David E and Banducci Charlene R
Bought by
Calderone Terrence J and Calderone Denise M
Home Financials for this Owner
Home Financials are based on the most recent Mortgage that was taken out on this home.
Original Mortgage
$549,000
Interest Rate
6.12%
Mortgage Type
Purchase Money Mortgage
Create a Home Valuation Report for This Property
The Home Valuation Report is an in-depth analysis detailing your home's value as well as a comparison with similar homes in the area
Home Values in the Area
Average Home Value in this Area
Purchase History
| Date | Buyer | Sale Price | Title Company |
|---|---|---|---|
| Ganu Sunil | $870,000 | Fidelity National Title Co | |
| Calderone Terrence J | $915,000 | Chicago Title Company |
Source: Public Records
Mortgage History
| Date | Status | Borrower | Loan Amount |
|---|---|---|---|
| Open | Ganu Sunil | $686,800 | |
| Previous Owner | Calderone Terrence J | $549,000 |
Source: Public Records
Tax History Compared to Growth
Tax History
| Year | Tax Paid | Tax Assessment Tax Assessment Total Assessment is a certain percentage of the fair market value that is determined by local assessors to be the total taxable value of land and additions on the property. | Land | Improvement |
|---|---|---|---|---|
| 2025 | $14,279 | $1,114,292 | $835,708 | $278,584 |
| 2024 | $14,279 | $1,092,444 | $819,322 | $273,122 |
| 2023 | $14,117 | $1,071,024 | $803,257 | $267,767 |
| 2022 | $14,100 | $1,050,024 | $787,507 | $262,517 |
| 2021 | $13,901 | $1,029,436 | $772,066 | $257,370 |
| 2020 | $13,645 | $1,018,881 | $764,150 | $254,731 |
| 2019 | $13,361 | $998,904 | $749,167 | $249,737 |
| 2018 | $12,988 | $979,319 | $734,478 | $244,841 |
| 2017 | $12,928 | $960,118 | $720,077 | $240,041 |
| 2016 | $12,541 | $941,293 | $705,958 | $235,335 |
| 2015 | $12,465 | $927,155 | $695,354 | $231,801 |
| 2014 | $11,809 | $908,994 | $681,733 | $227,261 |
Source: Public Records
Map
Nearby Homes
- 810 Raintree Dr
- 1002 Oaktree Dr
- 18817 Tuggle Ave
- 1018 Huntingdon Dr
- 18630 Crabtree Ave
- 10860 Johnson Ave
- 5187 Doyle Rd
- 1154 Bentoak Ln
- 18901 Tuggle Ave
- 5011 Lapa Dr
- 4792 Raspberry Place
- 10337 Menhart Ln
- 4733 Lago Vista Cir
- 5597 Glenoak Ct
- 998 Cera Dr
- 4626 Moorpark Ave
- 5177 Englewood Dr
- 4640 Venice Way
- 477 Greendale Way
- 4815 Capistrano Ave
- 857 Raintree Dr
- 847 Raintree Dr
- 5193 Glentree Dr
- 839 Raintree Dr
- 852 Doyle Rd
- 868 Raintree Ct
- 5179 Glentree Dr
- 846 Doyle Rd
- 920 Forest Ridge Dr
- 835 Raintree Dr
- 840 Raintree Dr
- 876 Raintree Ct
- 865 Raintree Ct
- 834 Doyle Rd
- 5167 Glentree Dr
- 918 Forest Ridge Dr
- 5154 Forest Glen Dr
- 829 Raintree Dr
- 873 Raintree Ct
- 884 Raintree Ct