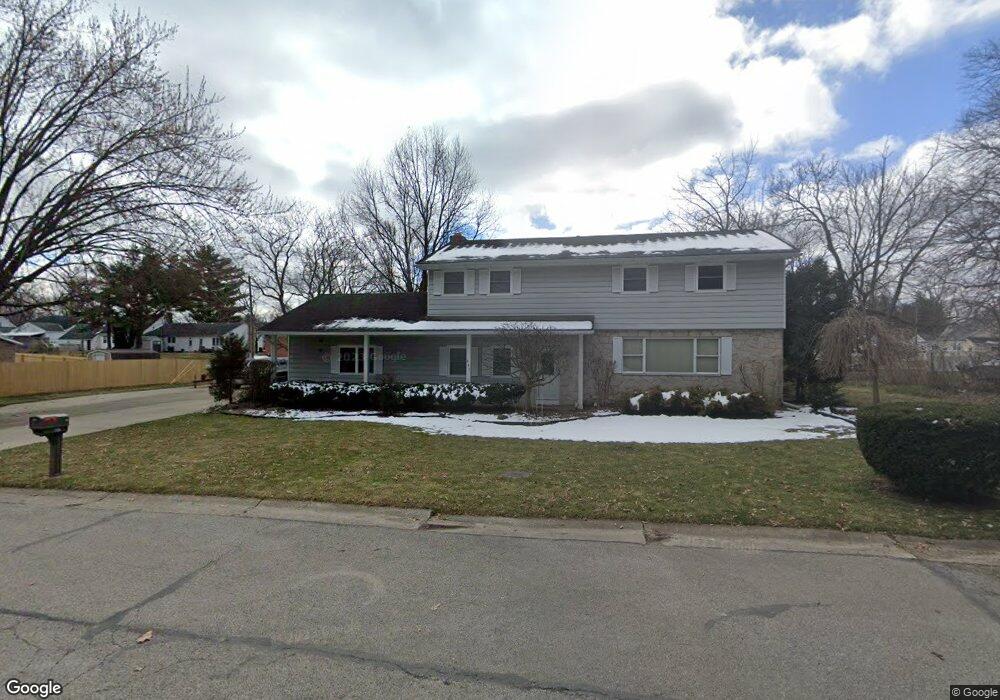
857 Strong St Napoleon, OH 43545
Estimated Value: $221,000 - $284,000
4
Beds
2
Baths
2,160
Sq Ft
$121/Sq Ft
Est. Value
About This Home
This home is located at 857 Strong St, Napoleon, OH 43545 and is currently estimated at $262,181, approximately $121 per square foot. 857 Strong St is a home located in Henry County with nearby schools including Napoleon Elementary School, Napoleon Junior/Senior High School, and St. Paul Lutheran School.
Ownership History
Date
Name
Owned For
Owner Type
Purchase Details
Closed on
Jun 8, 2016
Sold by
Rasey Deborah S and Miller Deborah S
Bought by
Miller Rick L
Current Estimated Value
Home Financials for this Owner
Home Financials are based on the most recent Mortgage that was taken out on this home.
Original Mortgage
$132,000
Interest Rate
3.66%
Mortgage Type
New Conventional
Purchase Details
Closed on
Jul 31, 2009
Sold by
Duryea Steven J
Bought by
Miller Rick L and Miller Deborah S
Purchase Details
Closed on
Jul 30, 2009
Sold by
Miller Rick L and Miller Deborah S
Bought by
Miller Rick L and Miller Deborah S
Purchase Details
Closed on
Sep 23, 2005
Sold by
Walker Donald Rex and Walker Barbara A
Bought by
Miller Rick L and Miller Deborah S
Home Financials for this Owner
Home Financials are based on the most recent Mortgage that was taken out on this home.
Original Mortgage
$136,000
Interest Rate
5.93%
Mortgage Type
Fannie Mae Freddie Mac
Create a Home Valuation Report for This Property
The Home Valuation Report is an in-depth analysis detailing your home's value as well as a comparison with similar homes in the area
Home Values in the Area
Average Home Value in this Area
Purchase History
| Date | Buyer | Sale Price | Title Company |
|---|---|---|---|
| Miller Rick L | -- | Attorney | |
| Miller Rick L | $6,000 | Attorney | |
| Miller Rick L | -- | Attorney | |
| Miller Rick L | $170,000 | -- |
Source: Public Records
Mortgage History
| Date | Status | Borrower | Loan Amount |
|---|---|---|---|
| Closed | Miller Rick L | $132,000 | |
| Closed | Miller Rick L | $136,000 |
Source: Public Records
Tax History Compared to Growth
Tax History
| Year | Tax Paid | Tax Assessment Tax Assessment Total Assessment is a certain percentage of the fair market value that is determined by local assessors to be the total taxable value of land and additions on the property. | Land | Improvement |
|---|---|---|---|---|
| 2024 | $3,272 | $78,990 | $13,310 | $65,680 |
| 2023 | $3,272 | $78,990 | $13,310 | $65,680 |
| 2022 | $3,290 | $147,040 | $22,620 | $124,420 |
| 2021 | $3,289 | $73,520 | $11,310 | $62,210 |
| 2020 | $3,461 | $73,520 | $11,310 | $62,210 |
| 2019 | $3,026 | $62,300 | $9,890 | $52,410 |
| 2018 | $2,952 | $62,300 | $9,890 | $52,410 |
| 2017 | $2,840 | $62,300 | $9,890 | $52,410 |
| 2016 | $2,612 | $55,620 | $9,890 | $45,730 |
| 2015 | $2,565 | $55,620 | $9,890 | $45,730 |
| 2014 | $2,894 | $55,620 | $9,890 | $45,730 |
| 2013 | $2,894 | $58,540 | $9,890 | $48,650 |
Source: Public Records
Map
Nearby Homes
- 900 Welsted St
- 725 Sheffield Ave
- 825 Old School Dr
- 551 W Main St
- 1354 Clairmont Ave
- 513 W Washington St
- 432 W Clinton St
- 1214 Clairmont Ave
- 342 W Clinton St
- 1314 Clairmont Ave
- 1113 Clairmont Ave
- 1050 Indiana Ave
- 0 Westmoreland Ave
- 00 Westmoreland Ave
- 1374 Clairmont Ave
- 1109 Highland Ave
- 1122 Ohio St
- 1124 Highland Ave
- 1309 Lagrange St
- 1081 Scott St