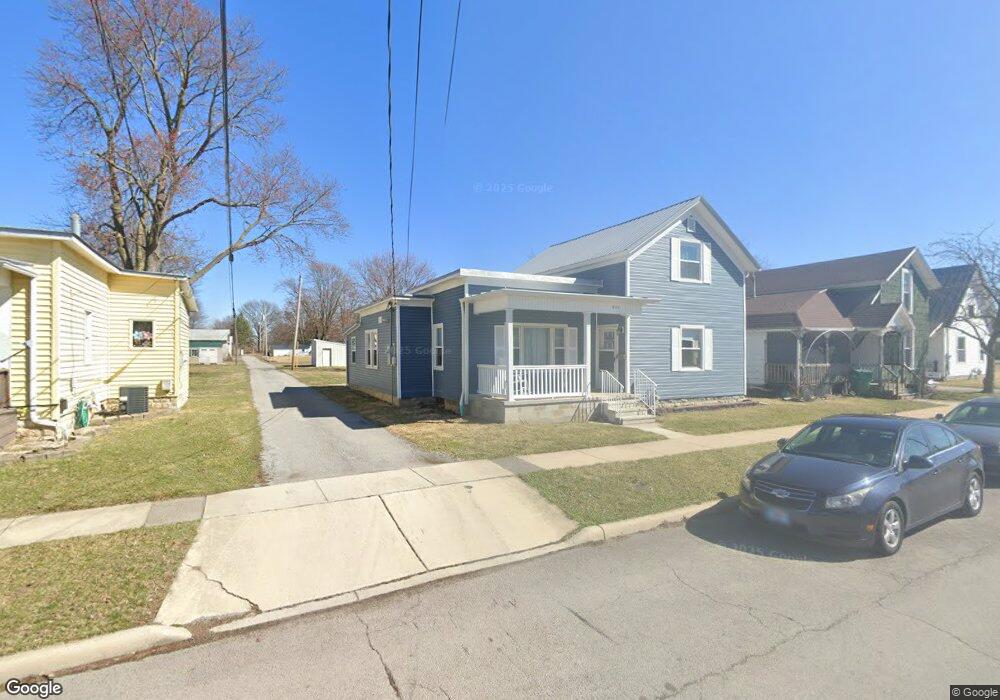
857 Wilson St Findlay, OH 45840
Estimated Value: $139,000 - $194,000
3
Beds
2
Baths
1,640
Sq Ft
$105/Sq Ft
Est. Value
About This Home
This home is located at 857 Wilson St, Findlay, OH 45840 and is currently estimated at $171,774, approximately $104 per square foot. 857 Wilson St is a home located in Hancock County with nearby schools including Whittier Elementary School, Wilson Vance Elementary School, and Donnell Middle School.
Ownership History
Date
Name
Owned For
Owner Type
Purchase Details
Closed on
Sep 7, 2023
Sold by
Edinger Joseph
Bought by
Majeska Kathryn and Stinchcomb Zachariah
Current Estimated Value
Home Financials for this Owner
Home Financials are based on the most recent Mortgage that was taken out on this home.
Original Mortgage
$155,200
Outstanding Balance
$151,815
Interest Rate
6.81%
Mortgage Type
New Conventional
Estimated Equity
$19,959
Purchase Details
Closed on
Nov 2, 2022
Sold by
Steiff Richard J and Steiff Betty L
Bought by
Edinger Joseph F
Purchase Details
Closed on
Sep 27, 2021
Sold by
Steiff Betty L and Steiff Richard J
Bought by
Steiff Betty L and Steiff Richard J
Purchase Details
Closed on
Aug 7, 2006
Sold by
Miles John P
Bought by
Steiff Betty Lou
Purchase Details
Closed on
Mar 28, 2003
Sold by
Miles Janet K
Bought by
Miles John P
Create a Home Valuation Report for This Property
The Home Valuation Report is an in-depth analysis detailing your home's value as well as a comparison with similar homes in the area
Home Values in the Area
Average Home Value in this Area
Purchase History
| Date | Buyer | Sale Price | Title Company |
|---|---|---|---|
| Majeska Kathryn | -- | Whitman Title | |
| Edinger Joseph F | -- | Whitman Title | |
| Steiff Betty L | -- | None Available | |
| Steiff Betty Lou | $70,666 | None Available | |
| Miles John P | -- | -- |
Source: Public Records
Mortgage History
| Date | Status | Borrower | Loan Amount |
|---|---|---|---|
| Open | Majeska Kathryn | $155,200 |
Source: Public Records
Tax History Compared to Growth
Tax History
| Year | Tax Paid | Tax Assessment Tax Assessment Total Assessment is a certain percentage of the fair market value that is determined by local assessors to be the total taxable value of land and additions on the property. | Land | Improvement |
|---|---|---|---|---|
| 2024 | $1,185 | $33,350 | $4,560 | $28,790 |
| 2023 | $1,187 | $33,350 | $4,560 | $28,790 |
| 2022 | $1,213 | $33,350 | $4,560 | $28,790 |
| 2021 | $1,008 | $24,120 | $4,560 | $19,560 |
| 2020 | $1,007 | $24,120 | $4,560 | $19,560 |
| 2019 | $988 | $24,120 | $4,560 | $19,560 |
| 2018 | $863 | $19,290 | $4,140 | $15,150 |
| 2017 | $431 | $19,290 | $4,140 | $15,150 |
| 2016 | $861 | $19,290 | $4,140 | $15,150 |
| 2015 | $873 | $19,400 | $4,140 | $15,260 |
| 2014 | $873 | $19,400 | $4,140 | $15,260 |
| 2012 | $868 | $19,100 | $4,140 | $14,960 |
Source: Public Records
Map
Nearby Homes
- 904 Morse St
- 820 Selby St
- 817 Park St
- 420 1st St
- 1109 Park St
- 15591 Canadian Way
- 15586 Canadian Way
- 15615 Canadian Way
- 829 Maple Ave
- 1109 Brookside Dr
- 202 Hancock St
- 1037 Fishlock Ave
- 1011 Stall Dr
- 804 6th St
- 1008 Eastview Dr
- 619 Fishlock Ave
- 210 Eastowne Park Row
- 1001 Decker Ave
- 1301 Fishlock Ave
- 123 Glendale Ave