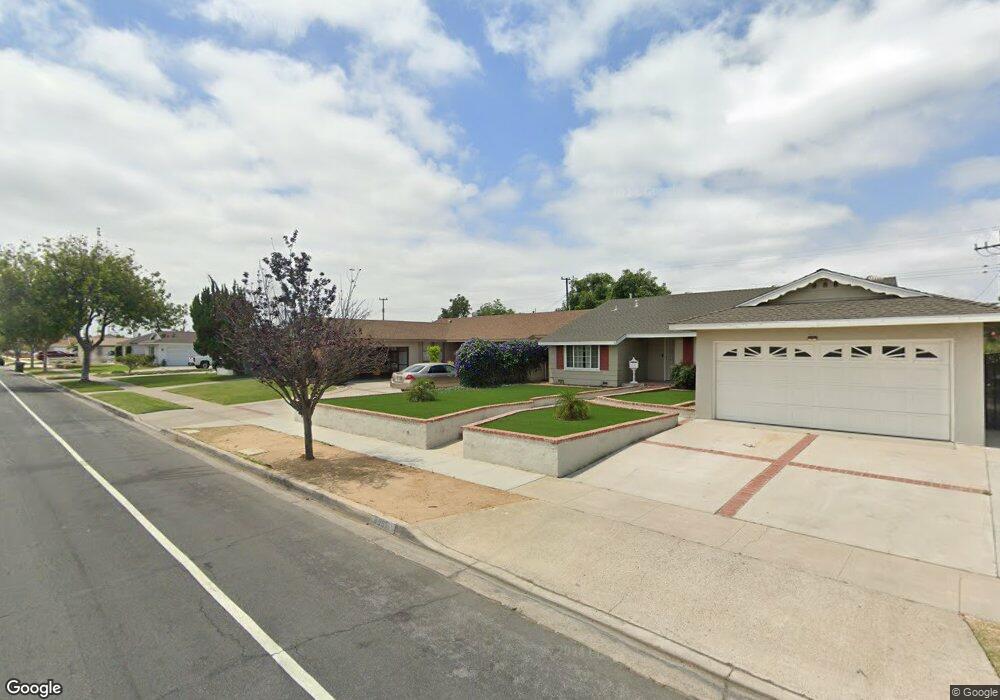
8571 Bel Air St Buena Park, CA 90620
Estimated Value: $943,422 - $1,014,000
3
Beds
2
Baths
1,841
Sq Ft
$533/Sq Ft
Est. Value
About This Home
This home is located at 8571 Bel Air St, Buena Park, CA 90620 and is currently estimated at $982,106, approximately $533 per square foot. 8571 Bel Air St is a home located in Orange County with nearby schools including Glen H. Dysinger Sr. Elementary School, Dale Jr High School, and Savanna High School.
Ownership History
Date
Name
Owned For
Owner Type
Purchase Details
Closed on
Dec 18, 2012
Sold by
Panganiban Pilar C
Bought by
Panganiban Properties Llc
Current Estimated Value
Purchase Details
Closed on
Apr 18, 2007
Sold by
Panganiban Pilar C
Bought by
Panganiban Pilar C and Pilar C Panganiban Revocable Trust
Purchase Details
Closed on
Jun 28, 2005
Sold by
Panganiban Pilar C
Bought by
Panganiban Pilar C and Pilar C Panganiban Revocable Trust
Purchase Details
Closed on
Feb 16, 2005
Sold by
Panganiban Pilar C
Bought by
Panganiban Pilar C
Home Financials for this Owner
Home Financials are based on the most recent Mortgage that was taken out on this home.
Original Mortgage
$424,000
Interest Rate
6%
Mortgage Type
Purchase Money Mortgage
Purchase Details
Closed on
Nov 22, 2000
Sold by
Panganiban Pilar C
Bought by
Panganiban Pilar C and Pilar C Panganiban Revocable Trust
Create a Home Valuation Report for This Property
The Home Valuation Report is an in-depth analysis detailing your home's value as well as a comparison with similar homes in the area
Home Values in the Area
Average Home Value in this Area
Purchase History
| Date | Buyer | Sale Price | Title Company |
|---|---|---|---|
| Panganiban Properties Llc | -- | None Available | |
| Panganiban Pilar C | -- | None Available | |
| Panganiban Pilar C | -- | -- | |
| Panganiban Pilar C | -- | Diversified Title & Escrow S | |
| Panganiban Pilar C | -- | -- |
Source: Public Records
Mortgage History
| Date | Status | Borrower | Loan Amount |
|---|---|---|---|
| Closed | Panganiban Pilar C | $424,000 |
Source: Public Records
Tax History Compared to Growth
Tax History
| Year | Tax Paid | Tax Assessment Tax Assessment Total Assessment is a certain percentage of the fair market value that is determined by local assessors to be the total taxable value of land and additions on the property. | Land | Improvement |
|---|---|---|---|---|
| 2025 | $4,893 | $414,843 | $297,195 | $117,648 |
| 2024 | $4,893 | $406,709 | $291,367 | $115,342 |
| 2023 | $4,773 | $398,735 | $285,654 | $113,081 |
| 2022 | $4,713 | $390,917 | $280,053 | $110,864 |
| 2021 | $4,646 | $383,252 | $274,561 | $108,691 |
| 2020 | $4,619 | $379,323 | $271,746 | $107,577 |
| 2019 | $4,505 | $371,886 | $266,418 | $105,468 |
| 2018 | $4,424 | $364,595 | $261,195 | $103,400 |
| 2017 | $4,287 | $357,447 | $256,074 | $101,373 |
| 2016 | $4,206 | $350,439 | $251,053 | $99,386 |
| 2015 | $4,160 | $345,176 | $247,282 | $97,894 |
| 2014 | $3,952 | $338,415 | $242,438 | $95,977 |
Source: Public Records
Map
Nearby Homes
- 2955 W Lincoln Ave Unit 7
- 8452 Stanton Ave
- 2871 W Tyler Ave
- 2943 W Lincoln Ave
- 8319 Hickory Dr
- 7950 Jackson Way
- 400 N Syracuse St
- 3053 W Coolidge Ave
- Plan Two at Mason
- Plan Four at Mason
- Plan Three at Mason
- Plan Seven at Mason
- 109 S Laxore St
- 103 S Laxore St
- 106 S Laxore St Unit 407
- 107 S Laxore St
- 7720 Crescent Ave
- 605 N La Reina St
- 2770 W Lincoln Ave Unit 40
- 2770 W Lincoln Ave Unit 58
- 8561 Bel Air St
- 8581 Bel Air St
- 8224 Mahogany Cir
- 8541 Bel Air St
- 8591 Bel Air St
- 8218 Mahogany Cir
- 8225 Mahogany Cir
- 8225 Joshua Cir
- 8531 Bel Air St
- 8572 Bel Air St
- 8219 Joshua Cir
- 8212 Mahogany Cir
- 8582 Bel Air St
- 8562 Bel Air St
- 8219 Mahogany Cir
- 8592 Bel Air St
- 8542 Bel Air St
- 8213 Joshua Cir
- 8213 Mahogany Cir
- 8611 Bel Air St