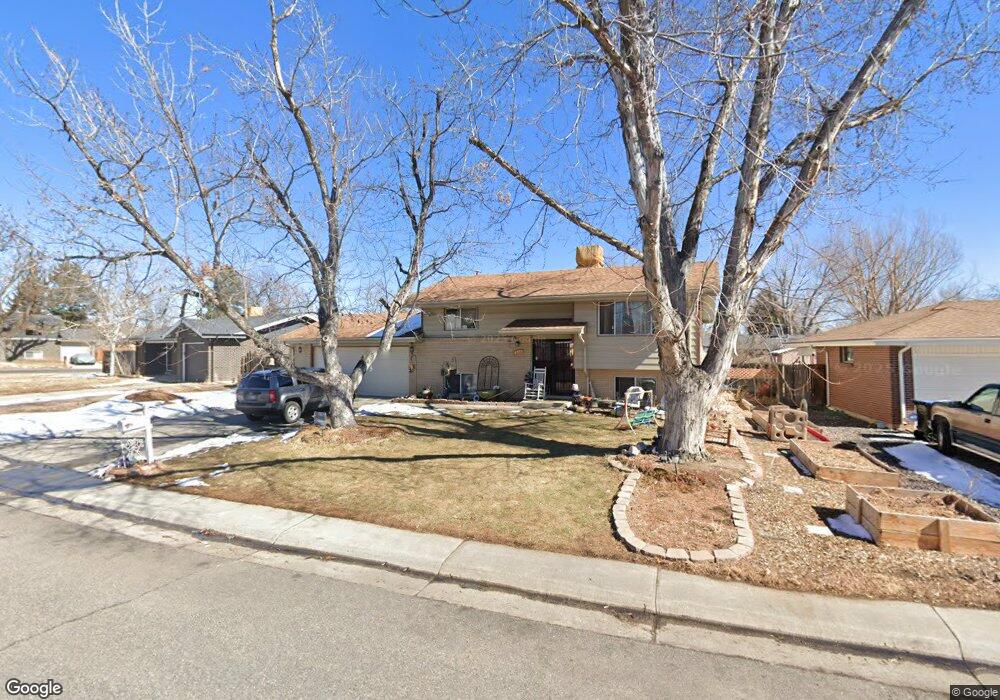
8574 Depew St Arvada, CO 80003
Far Horizons NeighborhoodEstimated Value: $529,651 - $559,000
5
Beds
2
Baths
1,777
Sq Ft
$304/Sq Ft
Est. Value
About This Home
This home is located at 8574 Depew St, Arvada, CO 80003 and is currently estimated at $540,413, approximately $304 per square foot. 8574 Depew St is a home located in Jefferson County with nearby schools including Noble Avenue Elementary School, Moore Middle School, and Pomona High School.
Ownership History
Date
Name
Owned For
Owner Type
Purchase Details
Closed on
Jun 25, 2015
Sold by
Webster Henry H and Webster Debra L
Bought by
Smith Genevieve and Smith Dewayne
Current Estimated Value
Home Financials for this Owner
Home Financials are based on the most recent Mortgage that was taken out on this home.
Original Mortgage
$262,163
Outstanding Balance
$208,336
Interest Rate
4.5%
Mortgage Type
FHA
Estimated Equity
$332,077
Purchase Details
Closed on
Aug 26, 2004
Sold by
Dyer Kathy S
Bought by
Webster Henry H and Webster Debra L
Home Financials for this Owner
Home Financials are based on the most recent Mortgage that was taken out on this home.
Original Mortgage
$210,032
Interest Rate
6%
Mortgage Type
FHA
Purchase Details
Closed on
Jun 17, 1997
Sold by
Paine Suzanne I
Bought by
Dyer Kathy S
Home Financials for this Owner
Home Financials are based on the most recent Mortgage that was taken out on this home.
Original Mortgage
$99,200
Interest Rate
7.93%
Mortgage Type
Balloon
Create a Home Valuation Report for This Property
The Home Valuation Report is an in-depth analysis detailing your home's value as well as a comparison with similar homes in the area
Home Values in the Area
Average Home Value in this Area
Purchase History
| Date | Buyer | Sale Price | Title Company |
|---|---|---|---|
| Smith Genevieve | $267,000 | Stewart Title | |
| Webster Henry H | $213,000 | Fahtco | |
| Dyer Kathy S | $124,000 | -- |
Source: Public Records
Mortgage History
| Date | Status | Borrower | Loan Amount |
|---|---|---|---|
| Open | Smith Genevieve | $262,163 | |
| Previous Owner | Webster Henry H | $210,032 | |
| Previous Owner | Dyer Kathy S | $99,200 |
Source: Public Records
Tax History Compared to Growth
Tax History
| Year | Tax Paid | Tax Assessment Tax Assessment Total Assessment is a certain percentage of the fair market value that is determined by local assessors to be the total taxable value of land and additions on the property. | Land | Improvement |
|---|---|---|---|---|
| 2024 | $2,957 | $30,482 | $12,208 | $18,274 |
| 2023 | $2,957 | $30,482 | $12,208 | $18,274 |
| 2022 | $2,418 | $24,688 | $8,058 | $16,630 |
| 2021 | $2,458 | $25,399 | $8,290 | $17,109 |
| 2020 | $2,267 | $23,495 | $7,760 | $15,735 |
| 2019 | $2,237 | $23,495 | $7,760 | $15,735 |
| 2018 | $1,930 | $19,707 | $5,908 | $13,799 |
| 2017 | $1,766 | $19,707 | $5,908 | $13,799 |
| 2016 | $1,717 | $18,049 | $6,794 | $11,255 |
| 2015 | -- | $18,049 | $6,794 | $11,255 |
| 2014 | $1,432 | $14,145 | $6,408 | $7,737 |
Source: Public Records
Map
Nearby Homes