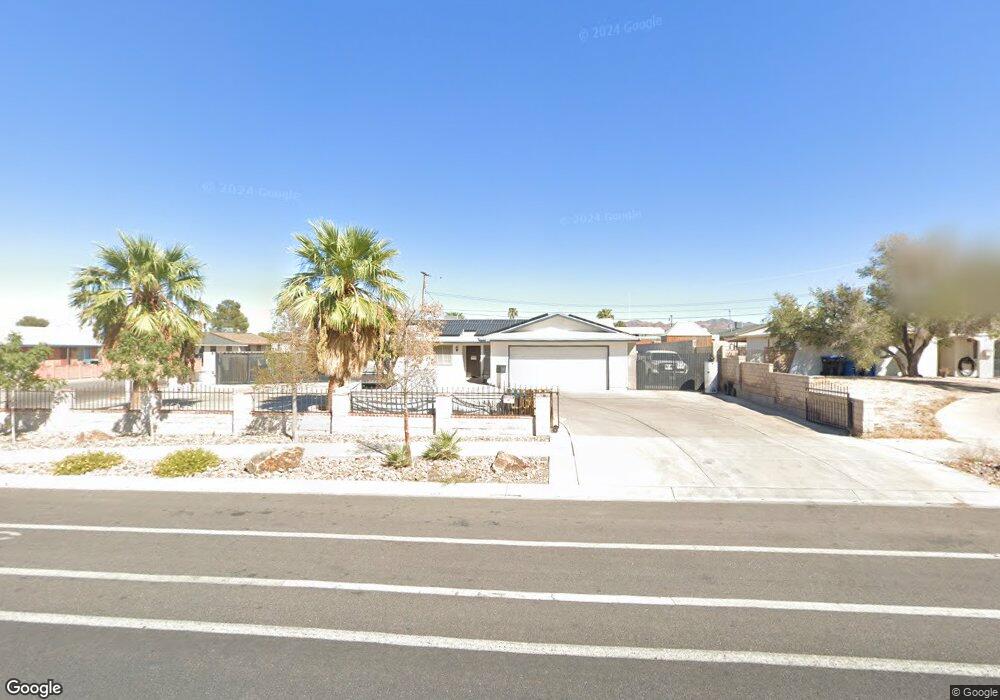
858 Center St Henderson, NV 89015
Valley View NeighborhoodEstimated Value: $467,000 - $506,000
3
Beds
2
Baths
1,650
Sq Ft
$296/Sq Ft
Est. Value
About This Home
This home is located at 858 Center St, Henderson, NV 89015 and is currently estimated at $488,149, approximately $295 per square foot. 858 Center St is a home located in Clark County with nearby schools including Robert L Taylor Elementary School, B Mahlon Brown Academy of International Studies, and Basic Academy of International Studies.
Ownership History
Date
Name
Owned For
Owner Type
Purchase Details
Closed on
Aug 21, 2009
Sold by
Brogan Tina D
Bought by
Brogan Michael H
Current Estimated Value
Purchase Details
Closed on
Oct 9, 2006
Sold by
Justice Joni and Dambra Anthony
Bought by
Brogan Michael Hugh and Brogan Tina Diantha
Home Financials for this Owner
Home Financials are based on the most recent Mortgage that was taken out on this home.
Original Mortgage
$256,000
Outstanding Balance
$149,409
Interest Rate
6.44%
Mortgage Type
Unknown
Estimated Equity
$338,740
Purchase Details
Closed on
Aug 8, 2002
Sold by
Dambra Anthony and Justice Joni
Bought by
Dambra Anthony and Justice Joni
Home Financials for this Owner
Home Financials are based on the most recent Mortgage that was taken out on this home.
Original Mortgage
$135,000
Interest Rate
6.51%
Create a Home Valuation Report for This Property
The Home Valuation Report is an in-depth analysis detailing your home's value as well as a comparison with similar homes in the area
Home Values in the Area
Average Home Value in this Area
Purchase History
| Date | Buyer | Sale Price | Title Company |
|---|---|---|---|
| Brogan Michael H | -- | None Available | |
| Brogan Michael Hugh | $320,000 | Equity Title Of Nevada | |
| Dambra Anthony | -- | Fidelity National Title |
Source: Public Records
Mortgage History
| Date | Status | Borrower | Loan Amount |
|---|---|---|---|
| Open | Brogan Michael Hugh | $256,000 | |
| Previous Owner | Dambra Anthony | $135,000 |
Source: Public Records
Tax History
| Year | Tax Paid | Tax Assessment Tax Assessment Total Assessment is a certain percentage of the fair market value that is determined by local assessors to be the total taxable value of land and additions on the property. | Land | Improvement |
|---|---|---|---|---|
| 2026 | $2,187 | $105,166 | $49,000 | $56,166 |
| 2025 | $2,123 | $110,771 | $52,500 | $58,271 |
| 2024 | $2,062 | $110,771 | $52,500 | $58,271 |
| 2023 | $2,062 | $104,759 | $49,000 | $55,759 |
| 2022 | $2,002 | $83,824 | $32,200 | $51,624 |
| 2021 | $1,943 | $77,323 | $28,000 | $49,323 |
| 2020 | $1,884 | $79,807 | $30,450 | $49,357 |
| 2019 | $1,829 | $72,270 | $23,450 | $48,820 |
| 2018 | $1,776 | $64,216 | $16,800 | $47,416 |
| 2017 | $1,870 | $64,526 | $16,100 | $48,426 |
| 2016 | $1,682 | $59,345 | $10,500 | $48,845 |
| 2015 | $1,678 | $56,188 | $10,500 | $45,688 |
| 2014 | $1,629 | $56,124 | $10,500 | $45,624 |
Source: Public Records
Map
Nearby Homes
- 200 Elm St
- 839 Fairview Dr
- 139 Fir St
- 846 Fairview Dr
- 125 Cedar St
- 139 Constitution Ave
- 124 Fir St
- 907 N Major Ave
- 914 Palo Verde Dr
- 915 N Major Ave
- 412 Cindy Place
- 106 Juniper St
- 1003 Palo Verde Dr
- 113 Linden St
- 436 Ash St
- 663 Swift Eagle Ave
- 111 Maple St
- 0 Rd
- 260 Prairie Rose St
- 601 Cabrillo Cir Unit 1292
Your Personal Tour Guide
Ask me questions while you tour the home.