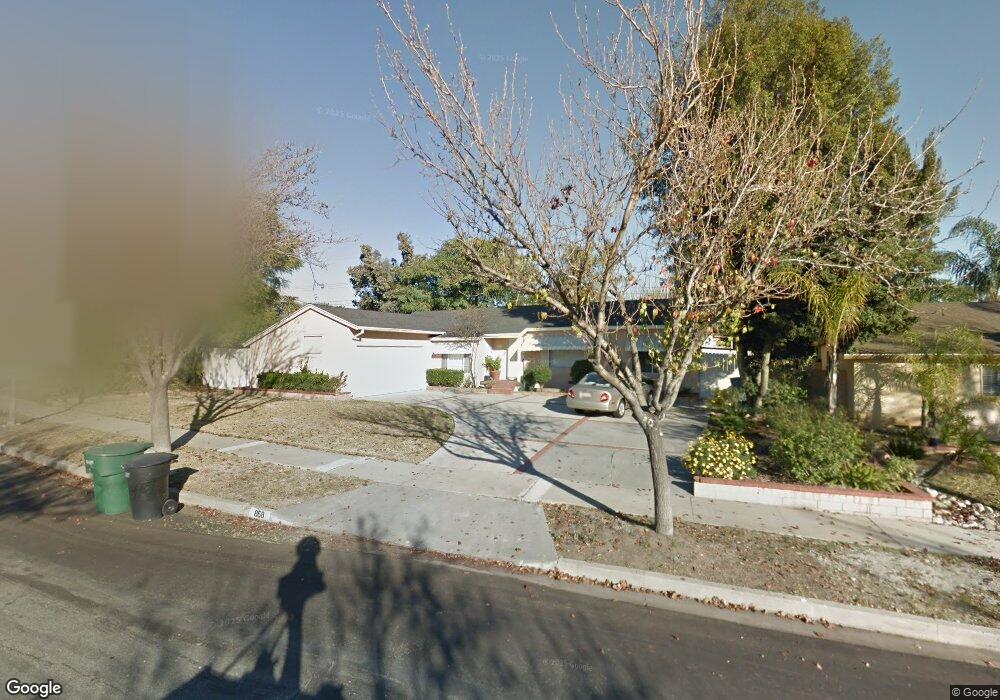
858 Drake Ave Claremont, CA 91711
Estimated Value: $719,000 - $806,000
3
Beds
2
Baths
1,416
Sq Ft
$543/Sq Ft
Est. Value
About This Home
This home is located at 858 Drake Ave, Claremont, CA 91711 and is currently estimated at $768,735, approximately $542 per square foot. 858 Drake Ave is a home located in Los Angeles County with nearby schools including Oakmont Outdoor School, El Roble Intermediate School, and Claremont High School.
Ownership History
Date
Name
Owned For
Owner Type
Purchase Details
Closed on
Jun 28, 2004
Sold by
Wj Marketing Inc
Bought by
Mcwilliams Claudia
Current Estimated Value
Home Financials for this Owner
Home Financials are based on the most recent Mortgage that was taken out on this home.
Original Mortgage
$289,600
Outstanding Balance
$135,407
Interest Rate
5.25%
Mortgage Type
Purchase Money Mortgage
Estimated Equity
$633,328
Purchase Details
Closed on
Feb 17, 2004
Sold by
Galarza Nilsa
Bought by
Wj Marketing Inc
Purchase Details
Closed on
Oct 10, 2000
Sold by
Tran Minh V and Tran Dina L
Bought by
Galarza Nilsa
Home Financials for this Owner
Home Financials are based on the most recent Mortgage that was taken out on this home.
Original Mortgage
$168,610
Interest Rate
7.82%
Mortgage Type
FHA
Create a Home Valuation Report for This Property
The Home Valuation Report is an in-depth analysis detailing your home's value as well as a comparison with similar homes in the area
Home Values in the Area
Average Home Value in this Area
Purchase History
| Date | Buyer | Sale Price | Title Company |
|---|---|---|---|
| Mcwilliams Claudia | $362,000 | Investors Title | |
| Wj Marketing Inc | $328,000 | Lawyers Title Company | |
| Galarza Nilsa | $170,000 | Benefit Land Title Ins Co |
Source: Public Records
Mortgage History
| Date | Status | Borrower | Loan Amount |
|---|---|---|---|
| Open | Mcwilliams Claudia | $289,600 | |
| Previous Owner | Galarza Nilsa | $168,610 | |
| Closed | Galarza Nilsa | $8,500 | |
| Closed | Mcwilliams Claudia | $72,400 |
Source: Public Records
Tax History Compared to Growth
Tax History
| Year | Tax Paid | Tax Assessment Tax Assessment Total Assessment is a certain percentage of the fair market value that is determined by local assessors to be the total taxable value of land and additions on the property. | Land | Improvement |
|---|---|---|---|---|
| 2025 | $6,380 | $504,581 | $295,503 | $209,078 |
| 2024 | $6,380 | $494,688 | $289,709 | $204,979 |
| 2023 | $6,245 | $484,989 | $284,029 | $200,960 |
| 2022 | $6,141 | $475,480 | $278,460 | $197,020 |
| 2021 | $6,040 | $466,157 | $273,000 | $193,157 |
| 2019 | $5,766 | $452,332 | $264,903 | $187,429 |
| 2018 | $5,580 | $443,463 | $259,709 | $183,754 |
| 2016 | $4,536 | $365,000 | $214,000 | $151,000 |
| 2015 | $4,422 | $355,000 | $207,700 | $147,300 |
| 2014 | $4,093 | $321,000 | $187,800 | $133,200 |
Source: Public Records
Map
Nearby Homes
- 126 Bryn Mawr Rd
- 1565 Ledgestone Ln
- 1748 Bonnie Brae St
- 1989 Annandale Way
- 1724 Fellows Place
- 646 Sycamore Ave Unit 18
- 442 Saint Augustine Ave
- 4424 San Jose St Unit 3
- 4552 La Deney St
- 1916 Mountain Ave
- 1142 Indian Hill Blvd
- 406 Marygrove Rd
- 266 Olive St
- 260 Olive St
- 472 Geneva Ave
- 4219 Fauna St
- 1968 Miramar St
- 4528 El Morado St
- 1441 Sheridan Ave
- 9642 Bolton Ave