Estimated Value: $797,000 - $883,722
5
Beds
4
Baths
2,585
Sq Ft
$325/Sq Ft
Est. Value
About This Home
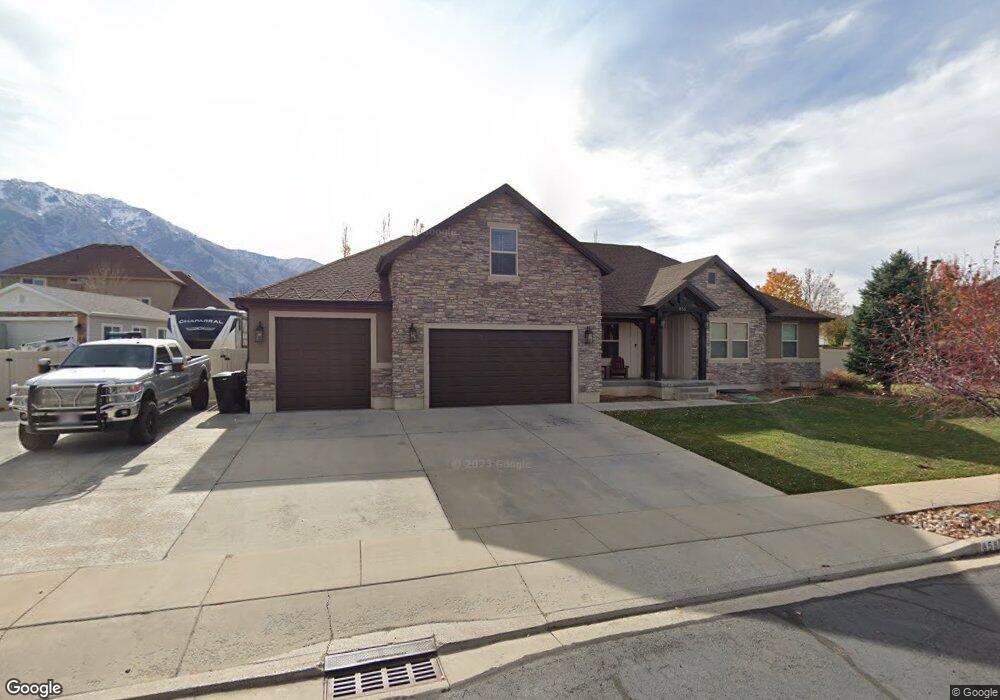
This home is located at 858 E 540 S Unit 9, Salem, UT 84653 and is currently estimated at $840,241, approximately $325 per square foot. 858 E 540 S Unit 9 is a home located in Utah County with nearby schools including Foothills Elementary School, Valley View Middle School, and Salem Junior High School.
Ownership History
Date
Name
Owned For
Owner Type
Purchase Details
Closed on
May 25, 2023
Sold by
Corless Cody and Corless Nicole
Bought by
Cody And Nicole Corless Family Trust
Current Estimated Value
Purchase Details
Closed on
Jan 8, 2013
Sold by
Edge Land 12 Llc
Bought by
Corless Cody and Corless Nicole
Home Financials for this Owner
Home Financials are based on the most recent Mortgage that was taken out on this home.
Original Mortgage
$302,647
Interest Rate
3.27%
Mortgage Type
New Conventional
Purchase Details
Closed on
Sep 7, 2012
Sold by
Rock Canyon Bank
Bought by
Edge Land 12 Llc
Purchase Details
Closed on
Aug 23, 2011
Sold by
Silver Ridge Llc
Bought by
Rock Canyon Bank
Create a Home Valuation Report for This Property
The Home Valuation Report is an in-depth analysis detailing your home's value as well as a comparison with similar homes in the area
Home Values in the Area
Average Home Value in this Area
Purchase History
| Date | Buyer | Sale Price | Title Company |
|---|---|---|---|
| Cody And Nicole Corless Family Trust | -- | Accommodation/Courtesy Recordi | |
| Corless Cody | -- | Affiliated First Title Co | |
| Edge Land 12 Llc | -- | Affiliated First Title Compa | |
| Rock Canyon Bank | -- | None Available |
Source: Public Records
Mortgage History
| Date | Status | Borrower | Loan Amount |
|---|---|---|---|
| Previous Owner | Corless Cody | $302,647 |
Source: Public Records
Tax History
| Year | Tax Paid | Tax Assessment Tax Assessment Total Assessment is a certain percentage of the fair market value that is determined by local assessors to be the total taxable value of land and additions on the property. | Land | Improvement |
|---|---|---|---|---|
| 2025 | $3,552 | $407,385 | -- | -- |
| 2024 | $3,552 | $360,250 | $0 | $0 |
| 2023 | $3,541 | $359,700 | $0 | $0 |
| 2022 | $3,876 | $387,750 | $0 | $0 |
| 2021 | $3,054 | $490,200 | $137,600 | $352,600 |
| 2020 | $3,014 | $470,800 | $125,100 | $345,700 |
| 2019 | $2,671 | $426,100 | $115,500 | $310,600 |
| 2018 | $2,724 | $415,200 | $115,500 | $299,700 |
| 2017 | $2,636 | $214,280 | $0 | $0 |
| 2016 | $2,623 | $210,760 | $0 | $0 |
| 2015 | $2,350 | $185,515 | $0 | $0 |
| 2014 | $2,286 | $180,675 | $0 | $0 |
Source: Public Records
Map
Nearby Homes
- 9800 Woodland Hills Dr
- 180 Woodland Hills Dr
- 881 E 820 S
- 1939 E Dorset Way Unit 306
- 1965 E Dorset Way Unit 303
- 1558 E 1010 N Unit 203
- 1984 E Dorset Way Unit 279
- 1802 E Albion Dr Unit 1142
- 1962 E Dorset Way Unit 276
- 1968 E Dorset Way Unit 277
- 1026 E 310 S
- 1003 E 310 S Unit 11
- 1036 E 310 S
- 1018 E 250 S
- 1034 E 250 S
- 1001 E 250 S
- 1033 E 250 S
- 173 E 10000 S
- 797 S 500 E Unit 12
- 88 S 850 E
- 857 E 600 S
- 884 E 540 S Unit 8
- 822 E 540 S
- 877 E 600 S Unit 11
- 857 E 540 S Unit 5
- 837 E 600 S Unit 25
- 837 E 600 S
- 893 E 540 S
- 893 E 540 S Unit 7
- 521 S 810 E
- 899 E 600 S
- 881 E 540 S
- 881 E 540 S Unit 6
- 802 E 540 S
- 817 E 600 S Unit 26
- 482 S 860 E
- 552 S 930 E Unit 14
- 917 E 600 S Unit 13
- 528 S 930 E
- 528 S 930 E Unit 15
Your Personal Tour Guide
Ask me questions while you tour the home.