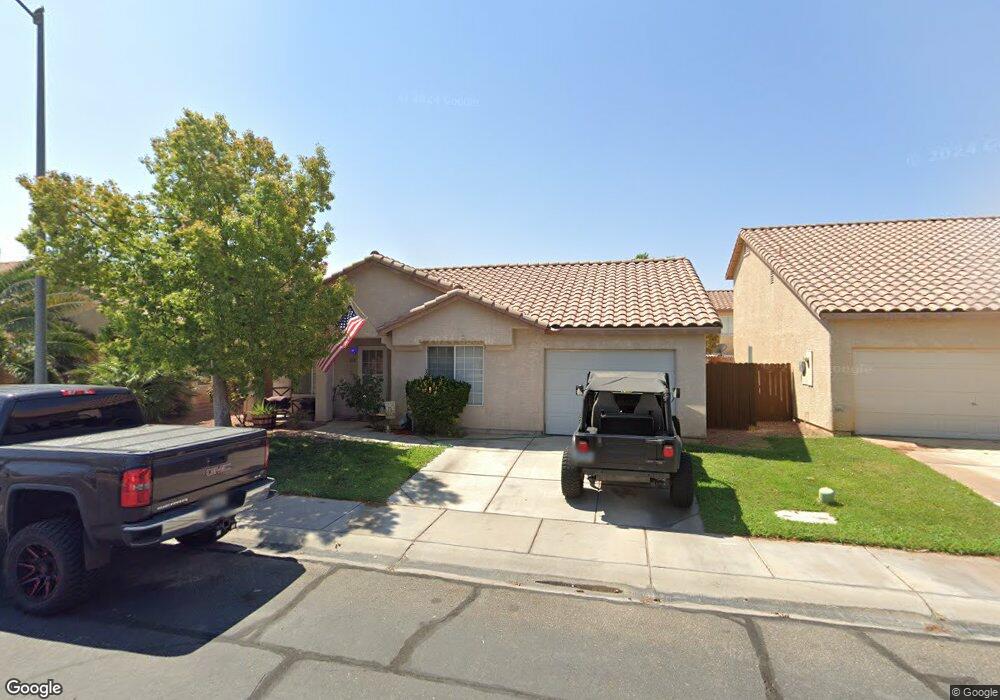
858 Jackrabbit St Mesquite, NV 89027
Estimated Value: $222,000 - $288,000
3
Beds
2
Baths
1,230
Sq Ft
$216/Sq Ft
Est. Value
About This Home
This home is located at 858 Jackrabbit St, Mesquite, NV 89027 and is currently estimated at $265,657, approximately $215 per square foot. 858 Jackrabbit St is a home located in Clark County with nearby schools including Virgin Valley Elementary School, Charles Arthur Hughes Middle School, and Virgin Valley High School.
Ownership History
Date
Name
Owned For
Owner Type
Purchase Details
Closed on
Oct 22, 2003
Sold by
Wells Fargo Home Mortgage Inc
Bought by
Hardesty Michael J
Current Estimated Value
Home Financials for this Owner
Home Financials are based on the most recent Mortgage that was taken out on this home.
Original Mortgage
$76,725
Interest Rate
6.14%
Mortgage Type
Seller Take Back
Purchase Details
Closed on
Apr 28, 2003
Sold by
Showell Aaron and Showell Alyce
Bought by
Wells Fargo Home Mortgage Inc and Norwest Mortgage Inc
Purchase Details
Closed on
Apr 12, 2000
Sold by
Blair Chris
Bought by
Showell Aaron and Showell Alyce
Home Financials for this Owner
Home Financials are based on the most recent Mortgage that was taken out on this home.
Original Mortgage
$92,095
Interest Rate
8.26%
Create a Home Valuation Report for This Property
The Home Valuation Report is an in-depth analysis detailing your home's value as well as a comparison with similar homes in the area
Home Values in the Area
Average Home Value in this Area
Purchase History
| Date | Buyer | Sale Price | Title Company |
|---|---|---|---|
| Hardesty Michael J | $95,910 | First American Title Company | |
| Wells Fargo Home Mortgage Inc | $96,430 | Fidelity National Title | |
| Showell Aaron | $92,095 | Nevada Title Company |
Source: Public Records
Mortgage History
| Date | Status | Borrower | Loan Amount |
|---|---|---|---|
| Closed | Hardesty Michael J | $76,725 | |
| Previous Owner | Showell Aaron | $92,095 |
Source: Public Records
Tax History Compared to Growth
Tax History
| Year | Tax Paid | Tax Assessment Tax Assessment Total Assessment is a certain percentage of the fair market value that is determined by local assessors to be the total taxable value of land and additions on the property. | Land | Improvement |
|---|---|---|---|---|
| 2025 | $1,363 | $75,966 | $22,050 | $53,916 |
| 2024 | $1,263 | $75,966 | $22,050 | $53,916 |
| 2023 | $1,263 | $71,977 | $21,000 | $50,977 |
| 2022 | $1,170 | $63,434 | $16,800 | $46,634 |
| 2021 | $1,083 | $60,048 | $15,750 | $44,298 |
| 2020 | $1,004 | $58,681 | $14,700 | $43,981 |
| 2019 | $941 | $56,250 | $12,950 | $43,300 |
| 2018 | $898 | $51,878 | $10,150 | $41,728 |
| 2017 | $1,308 | $46,934 | $9,100 | $37,834 |
| 2016 | $840 | $42,982 | $8,050 | $34,932 |
| 2015 | $838 | $32,885 | $6,300 | $26,585 |
| 2014 | $812 | $29,530 | $7,000 | $22,530 |
Source: Public Records
Map
Nearby Homes
- 375 Habib Way
- 463 Hagens Aly
- 364 Sam Way
- 294 Sam Way
- Beckett Plan at The Fields
- Weston Plan at The Fields
- Graham Plan at The Fields
- 287 Sam Way
- 254 Reber Dr
- 271 Concord Dr
- 777 2nd St S
- 581 Emperor Ln Unit 1
- 228 Hiawatha Way
- 162 Hermosa Way
- 262 Thistle St
- 517 W Mesquite Blvd
- 844 Sagedell Rd
- 844 Glendale Rd
- 840 W Pioneer
- 1389 Harbour Dr
- 862 Jackrabbit St
- 854 Jackrabbit St
- 861 Joshua Dr
- 865 Joshua Dr
- 857 Joshua Dr
- 866 Jackrabbit St
- 850 Jackrabbit St
- 869 Joshua Dr
- 859 Jackrabbit St
- 853 Joshua Dr
- 855 Jackrabbit St
- 863 Jackrabbit St
- 851 Jackrabbit St
- 846 Jackrabbit St
- 870 Jackrabbit St
- 873 Joshua Dr
- 849 Joshua Dr
- 867 Jackrabbit St
- 847 Jackrabbit St
- 860 Joshua Dr