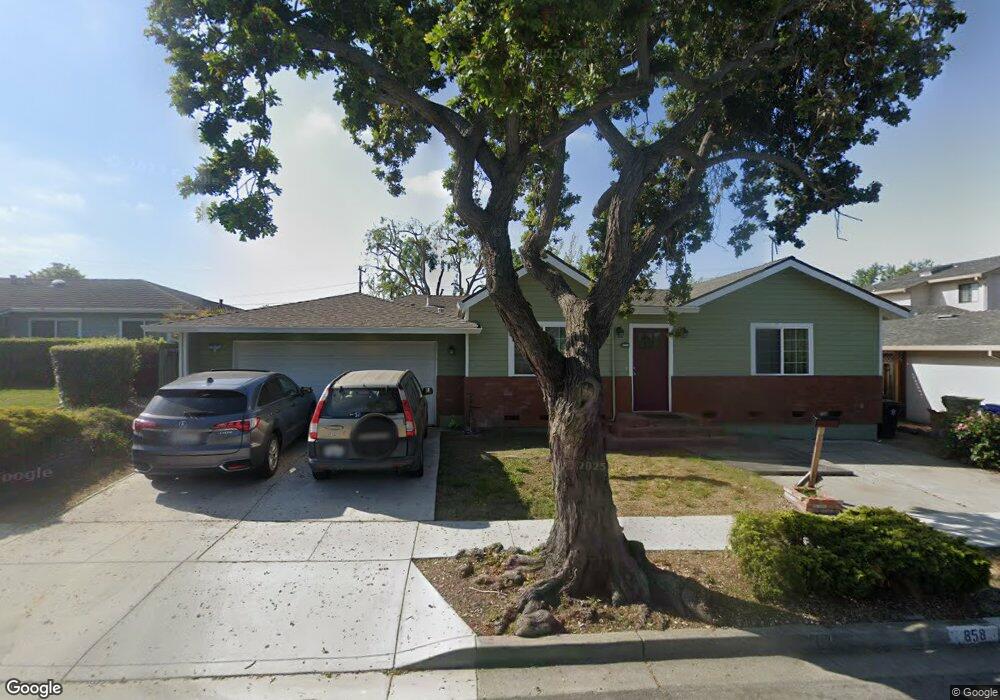
858 Wisteria Dr Fremont, CA 94539
Mission Valley NeighborhoodEstimated Value: $2,455,000 - $2,681,000
3
Beds
2
Baths
1,408
Sq Ft
$1,809/Sq Ft
Est. Value
About This Home
This home is located at 858 Wisteria Dr, Fremont, CA 94539 and is currently estimated at $2,546,442, approximately $1,808 per square foot. 858 Wisteria Dr is a home located in Alameda County with nearby schools including Joshua Chadbourne Elementary School, William Hopkins Junior High School, and Mission San Jose High School.
Ownership History
Date
Name
Owned For
Owner Type
Purchase Details
Closed on
Feb 16, 2025
Sold by
Francis Joe and Mathew Carolinmol
Bought by
Francis Mathew Family Trust and Francis
Current Estimated Value
Purchase Details
Closed on
Jul 22, 2011
Sold by
Lautz Katherine E and Stevenson Gordon M
Bought by
Francis Joe and Mathew Carolinmol
Home Financials for this Owner
Home Financials are based on the most recent Mortgage that was taken out on this home.
Original Mortgage
$667,500
Interest Rate
4.46%
Mortgage Type
New Conventional
Purchase Details
Closed on
Sep 30, 2009
Sold by
Stevenson Gordon M
Bought by
Lautz Katherine E and Stevenson Gordon M
Purchase Details
Closed on
Sep 14, 2009
Sold by
Stevenson Gordon M and Enez Miliani Family Trust
Bought by
Stevenson Gordon M
Purchase Details
Closed on
Sep 21, 1995
Sold by
Miliani Enez
Bought by
Stevenson Karen M and Stevenson Gordon M
Create a Home Valuation Report for This Property
The Home Valuation Report is an in-depth analysis detailing your home's value as well as a comparison with similar homes in the area
Home Values in the Area
Average Home Value in this Area
Purchase History
| Date | Buyer | Sale Price | Title Company |
|---|---|---|---|
| Francis Mathew Family Trust | -- | None Listed On Document | |
| Francis Joe | $905,000 | Chicago Title Company | |
| Lautz Katherine E | -- | None Available | |
| Stevenson Gordon M | -- | None Available | |
| Stevenson Karen M | -- | -- |
Source: Public Records
Mortgage History
| Date | Status | Borrower | Loan Amount |
|---|---|---|---|
| Previous Owner | Francis Joe | $667,500 |
Source: Public Records
Tax History Compared to Growth
Tax History
| Year | Tax Paid | Tax Assessment Tax Assessment Total Assessment is a certain percentage of the fair market value that is determined by local assessors to be the total taxable value of land and additions on the property. | Land | Improvement |
|---|---|---|---|---|
| 2025 | $15,019 | $1,278,143 | $596,595 | $688,548 |
| 2024 | $15,019 | $1,252,951 | $584,900 | $675,051 |
| 2023 | $14,628 | $1,235,251 | $573,434 | $661,817 |
| 2022 | $14,455 | $1,204,032 | $562,191 | $648,841 |
| 2021 | $14,096 | $1,180,293 | $551,171 | $636,122 |
| 2020 | $14,190 | $1,175,127 | $545,523 | $629,604 |
| 2019 | $14,025 | $1,152,093 | $534,831 | $617,262 |
| 2018 | $12,647 | $1,035,019 | $524,347 | $510,672 |
| 2017 | $11,919 | $979,435 | $514,068 | $465,367 |
| 2016 | $11,721 | $960,231 | $503,989 | $456,242 |
| 2015 | $11,571 | $945,815 | $496,422 | $449,393 |
| 2014 | $11,376 | $927,289 | $486,699 | $440,590 |
Source: Public Records
Map
Nearby Homes
- 1224 Bedford St
- 1873 Berry Ct
- 2225 Valorie St
- 41997 Via San Gabriel
- 42293 Camino Santa Barbara
- 42329 Troyer Ave
- 41246 Mission Blvd
- 41342 Joyce Ave
- 41252 Mission Blvd
- 335 Via Rosario
- 1962 Briscoe Terrace
- 41082 Joyce Ave
- 42955 Corte Verde
- 41043 Joyce Ave
- 42965 Corte Verde
- 41620 Beatrice St
- 2785 Washington Blvd
- 905 Glenhill Dr
- 41538 Casabella Common
- 124 Linmore Dr
- 844 Wisteria Dr
- 872 Wisteria Dr
- 903 Bedford St
- 927 Bedford St
- 830 Wisteria Dr
- 884 Wisteria Dr
- 883 Bedford St
- 859 Wisteria Dr
- 951 Bedford St
- 816 Wisteria Dr
- 845 Wisteria Dr
- 896 Wisteria Dr
- 831 Wisteria Dr
- 857 Bedford St
- 41787 Blossom Dr
- 920 Bedford St
- 902 Bedford St
- 802 Wisteria Dr
- 938 Bedford St
- 817 Wisteria Dr