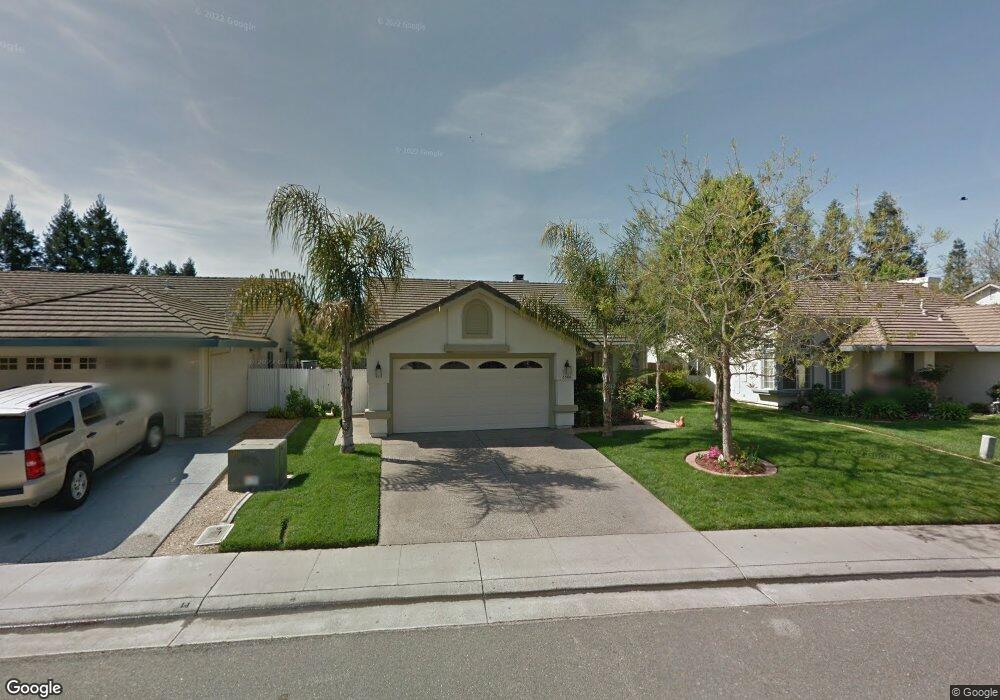
8586 Hydrangea Ct Elk Grove, CA 95624
North East Elk Grove NeighborhoodEstimated Value: $450,000 - $600,000
4
Beds
2
Baths
1,672
Sq Ft
$321/Sq Ft
Est. Value
About This Home
This home is located at 8586 Hydrangea Ct, Elk Grove, CA 95624 and is currently estimated at $537,111, approximately $321 per square foot. 8586 Hydrangea Ct is a home located in Sacramento County with nearby schools including Raymond Case Elementary School, Edward Harris Jr. Middle School, and Monterey Trail High School.
Ownership History
Date
Name
Owned For
Owner Type
Purchase Details
Closed on
May 17, 2001
Sold by
Morales Antonio
Bought by
Morales Antonio and Morales Silvia
Current Estimated Value
Home Financials for this Owner
Home Financials are based on the most recent Mortgage that was taken out on this home.
Original Mortgage
$75,000
Outstanding Balance
$28,067
Interest Rate
7.06%
Estimated Equity
$509,044
Purchase Details
Closed on
Jul 27, 1995
Sold by
Vanhoose Marion E and Vanhoose Rosemary J
Bought by
Terrasas Margarito and Terrasas Mary C
Home Financials for this Owner
Home Financials are based on the most recent Mortgage that was taken out on this home.
Original Mortgage
$96,000
Interest Rate
7.61%
Purchase Details
Closed on
Jun 22, 1994
Sold by
Jd Resources Inc
Bought by
Vanhoose Marion E and Vanhoose Rosemary J
Home Financials for this Owner
Home Financials are based on the most recent Mortgage that was taken out on this home.
Original Mortgage
$119,950
Interest Rate
8.83%
Create a Home Valuation Report for This Property
The Home Valuation Report is an in-depth analysis detailing your home's value as well as a comparison with similar homes in the area
Home Values in the Area
Average Home Value in this Area
Purchase History
| Date | Buyer | Sale Price | Title Company |
|---|---|---|---|
| Morales Antonio | -- | First American Title Ins Co | |
| Morales Antonio | -- | First American Title Ins Co | |
| Morales Antonio | $225,000 | First American Title Ins Co | |
| Terrasas Margarito | $120,000 | Chicago Title Co | |
| Vanhoose Marion E | $150,000 | Founders Title Company |
Source: Public Records
Mortgage History
| Date | Status | Borrower | Loan Amount |
|---|---|---|---|
| Open | Morales Antonio | $75,000 | |
| Previous Owner | Terrasas Margarito | $96,000 | |
| Previous Owner | Vanhoose Marion E | $119,950 |
Source: Public Records
Tax History
| Year | Tax Paid | Tax Assessment Tax Assessment Total Assessment is a certain percentage of the fair market value that is determined by local assessors to be the total taxable value of land and additions on the property. | Land | Improvement |
|---|---|---|---|---|
| 2025 | $3,753 | $338,939 | $82,863 | $256,076 |
| 2024 | $3,753 | $332,294 | $81,239 | $251,055 |
| 2023 | $3,656 | $325,780 | $79,647 | $246,133 |
| 2022 | $3,586 | $319,393 | $78,086 | $241,307 |
| 2021 | $3,534 | $313,131 | $76,555 | $236,576 |
| 2020 | $3,485 | $309,922 | $75,771 | $234,151 |
| 2019 | $3,419 | $303,846 | $74,286 | $229,560 |
| 2018 | $3,326 | $297,889 | $72,830 | $225,059 |
| 2017 | $3,265 | $292,049 | $71,402 | $220,647 |
| 2016 | $3,101 | $286,323 | $70,002 | $216,321 |
| 2015 | $3,043 | $282,023 | $68,951 | $213,072 |
| 2014 | $2,992 | $276,500 | $67,601 | $208,899 |
Source: Public Records
Map
Nearby Homes
- 8598 New Valley Way
- 8329 New Hills Ct
- 8559 Zinnia Way
- 8495 Zinnia Way
- 8859 Shasta Lily Dr
- 8592 Mystras Cir
- 8216 Exbourne Cir
- 8775 Liscarney Way
- 8908 Liscarney Way
- 8780 Frosses Ct
- 8794 Frosses Ct
- 8240 Bedford Cove Way
- 8809 Coral Berry Way
- 0 Calvine Rd Unit 225150022
- 8649 Red Clover Way
- 8880 Inisheer Way
- 8283 Glencannon Way
- 8247 Derbyshire Cir
- 8613 Aviary Woods Way
- 8725 Mesa Brook Way
- 8590 Hydrangea Ct
- 8582 Hydrangea Ct
- 8594 Hydrangea Ct
- 8581 Dianthus Way
- 8585 Dianthus Way
- 8575 Dianthus Way
- 8591 Dianthus Way
- 8589 Hydrangea Ct
- 8585 Hydrangea Ct
- 8574 Hydrangea Ct
- 8598 Hydrangea Ct
- 8571 Dianthus Way
- 8581 Hydrangea Ct
- 8593 Hydrangea Ct
- 8434 Sheldon North Dr
- 8577 Hydrangea Ct
- 8597 Hydrangea Ct
- 8438 Sheldon North Dr
- 8425 Winterberry Dr
- 8421 Winterberry Dr
Your Personal Tour Guide
Ask me questions while you tour the home.