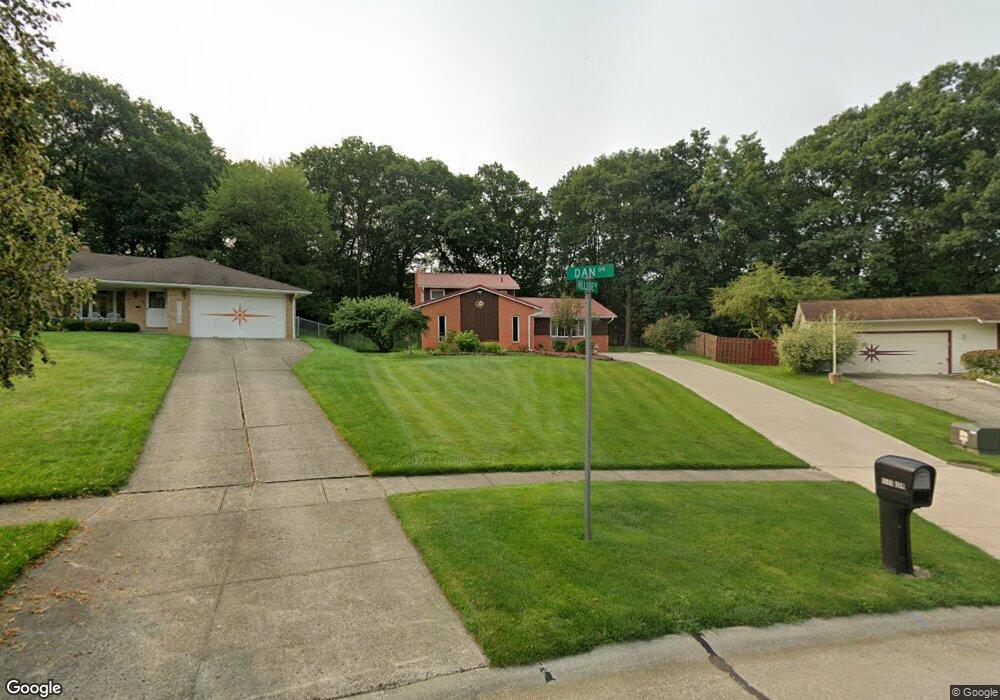
8589 Dan Dr North Royalton, OH 44133
Estimated Value: $343,440 - $380,000
3
Beds
2
Baths
2,294
Sq Ft
$156/Sq Ft
Est. Value
About This Home
This home is located at 8589 Dan Dr, North Royalton, OH 44133 and is currently estimated at $356,860, approximately $155 per square foot. 8589 Dan Dr is a home located in Cuyahoga County with nearby schools including North Royalton Middle School, North Royalton High School, and Royal Redeemer Lutheran School.
Ownership History
Date
Name
Owned For
Owner Type
Purchase Details
Closed on
Nov 6, 2024
Sold by
Scherba Igor V and Scherba Dariya
Bought by
Scherba Igor V and Scherba Dariya
Current Estimated Value
Home Financials for this Owner
Home Financials are based on the most recent Mortgage that was taken out on this home.
Original Mortgage
$211,843
Interest Rate
6.87%
Mortgage Type
Credit Line Revolving
Purchase Details
Closed on
Dec 13, 2005
Sold by
Ozimek Joseph R and Ozimek Mary H
Bought by
Shcherba Ihor and Shcherba Diriya
Home Financials for this Owner
Home Financials are based on the most recent Mortgage that was taken out on this home.
Original Mortgage
$41,000
Interest Rate
6.36%
Mortgage Type
Stand Alone Second
Purchase Details
Closed on
Dec 15, 1987
Sold by
Moore Marshall J
Bought by
Ozimek Joseph R
Purchase Details
Closed on
Mar 26, 1985
Sold by
Moore Marshall J and C L
Bought by
Moore Marshall J
Purchase Details
Closed on
Jan 1, 1975
Bought by
Moore Marshall J and C L
Create a Home Valuation Report for This Property
The Home Valuation Report is an in-depth analysis detailing your home's value as well as a comparison with similar homes in the area
Home Values in the Area
Average Home Value in this Area
Purchase History
| Date | Buyer | Sale Price | Title Company |
|---|---|---|---|
| Scherba Igor V | -- | None Listed On Document | |
| Shcherba Ihor | $204,900 | Public | |
| Ozimek Joseph R | $118,900 | -- | |
| Moore Marshall J | -- | -- | |
| Moore Marshall J | -- | -- |
Source: Public Records
Mortgage History
| Date | Status | Borrower | Loan Amount |
|---|---|---|---|
| Previous Owner | Scherba Igor V | $211,843 | |
| Previous Owner | Shcherba Ihor | $41,000 |
Source: Public Records
Tax History Compared to Growth
Tax History
| Year | Tax Paid | Tax Assessment Tax Assessment Total Assessment is a certain percentage of the fair market value that is determined by local assessors to be the total taxable value of land and additions on the property. | Land | Improvement |
|---|---|---|---|---|
| 2024 | $5,795 | $99,750 | $14,805 | $84,945 |
| 2023 | $4,607 | $72,740 | $11,380 | $61,360 |
| 2022 | $4,576 | $72,730 | $11,380 | $61,360 |
| 2021 | $4,624 | $72,730 | $11,380 | $61,360 |
| 2020 | $4,305 | $64,370 | $10,080 | $54,290 |
| 2019 | $4,179 | $183,900 | $28,800 | $155,100 |
| 2018 | $3,974 | $64,370 | $10,080 | $54,290 |
| 2017 | $3,730 | $54,290 | $9,700 | $44,590 |
| 2016 | $3,893 | $54,290 | $9,700 | $44,590 |
| 2015 | $4,310 | $54,290 | $9,700 | $44,590 |
| 2014 | $4,310 | $54,290 | $9,700 | $44,590 |
Source: Public Records
Map
Nearby Homes
- 8381 N Akins Rd Unit H7
- 7400 Akins Rd
- 13831 Woodcroft Trace
- 12906 Cartwright Pkwy
- 13000 Cartwright Pkwy
- S/L Margaret Dr
- 7554 Margaret Dr
- 7595 Margaret Dr
- 7545 Margaret Dr
- 7585 Margaret Dr
- 7575 Margaret Dr
- 7535 Margaret Dr
- 7555 Margaret Dr
- 7600 Margaret Dr
- 7564 Margaret Dr
- 7574 Margaret Dr
- 9447 Lindberg Dr
- 12701 Gordon St
- 9035 Wallings Rd
- 5299 Whistler Ct