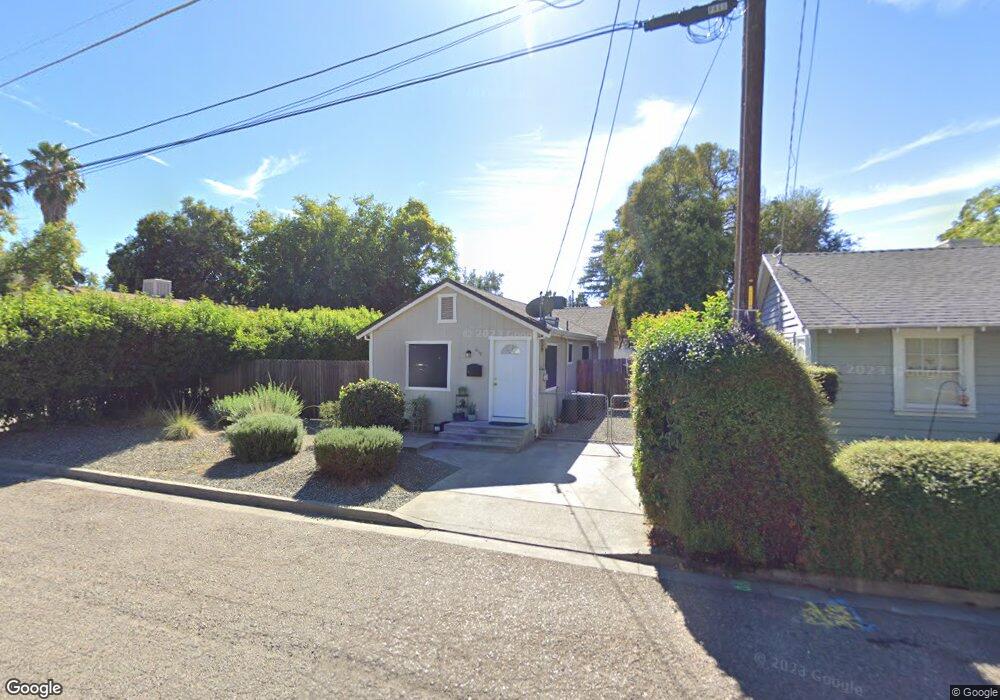
859 Locust St Red Bluff, CA 96080
Estimated Value: $170,000 - $241,000
3
Beds
1
Bath
908
Sq Ft
$215/Sq Ft
Est. Value
About This Home
This home is located at 859 Locust St, Red Bluff, CA 96080 and is currently estimated at $194,988, approximately $214 per square foot. 859 Locust St is a home located in Tehama County with nearby schools including Jackson Heights Elementary School, Vista Preparatory Academy, and Red Bluff High School.
Ownership History
Date
Name
Owned For
Owner Type
Purchase Details
Closed on
Sep 18, 2014
Sold by
Norcal Investors Inc
Bought by
Brovan Tina
Current Estimated Value
Purchase Details
Closed on
May 13, 2013
Sold by
Rodriguez Jose J and Rodriguez Norma A
Bought by
Norcal Investors Inc
Purchase Details
Closed on
May 4, 2005
Sold by
Thorne Floyd N and Thorne Candace A
Bought by
Rodriguez Jose J and Rodriguez Norma A
Home Financials for this Owner
Home Financials are based on the most recent Mortgage that was taken out on this home.
Original Mortgage
$95,600
Interest Rate
6.02%
Mortgage Type
Fannie Mae Freddie Mac
Create a Home Valuation Report for This Property
The Home Valuation Report is an in-depth analysis detailing your home's value as well as a comparison with similar homes in the area
Purchase History
| Date | Buyer | Sale Price | Title Company |
|---|---|---|---|
| Brovan Tina | $76,000 | Placer Title Company | |
| Norcal Investors Inc | $43,351 | None Available | |
| Rodriguez Jose J | $121,500 | Fidelity National Title |
Source: Public Records
Mortgage History
| Date | Status | Borrower | Loan Amount |
|---|---|---|---|
| Previous Owner | Rodriguez Jose J | $95,600 | |
| Closed | Rodriguez Jose J | $25,900 |
Source: Public Records
Tax History
| Year | Tax Paid | Tax Assessment Tax Assessment Total Assessment is a certain percentage of the fair market value that is determined by local assessors to be the total taxable value of land and additions on the property. | Land | Improvement |
|---|---|---|---|---|
| 2025 | $933 | $91,330 | $36,051 | $55,279 |
| 2023 | $917 | $87,786 | $34,652 | $53,134 |
| 2022 | $911 | $86,066 | $33,973 | $52,093 |
| 2021 | $875 | $84,379 | $33,307 | $51,072 |
| 2020 | $893 | $83,515 | $32,966 | $50,549 |
| 2019 | $898 | $81,878 | $32,320 | $49,558 |
| 2018 | $831 | $80,274 | $31,687 | $48,587 |
| 2017 | $765 | $78,701 | $31,066 | $47,635 |
| 2016 | $713 | $77,158 | $30,457 | $46,701 |
| 2015 | -- | $76,000 | $30,000 | $46,000 |
| 2014 | $718 | $70,317 | $30,136 | $40,181 |
Source: Public Records
Map
Nearby Homes
- 845 Olive St
- 821 Locust St
- 224 S Jackson St
- 406 S Jackson St
- 425 S Jackson St
- 1160 Orange St
- 910 Aloha St
- 1270 Aloha St
- 660 Villa Dr
- 1307 Deborah Dr
- 1210 Wetter Way
- 1402 Scottsdale Way
- 1212 S Jackson St
- 1455 Acacia St
- 1560 Carl Ct
- 728 Lincoln St
- 1480 Leonard Ln
- 524 Madison St
- 532 Madison St
- 1235 Britt Ln
Your Personal Tour Guide
Ask me questions while you tour the home.