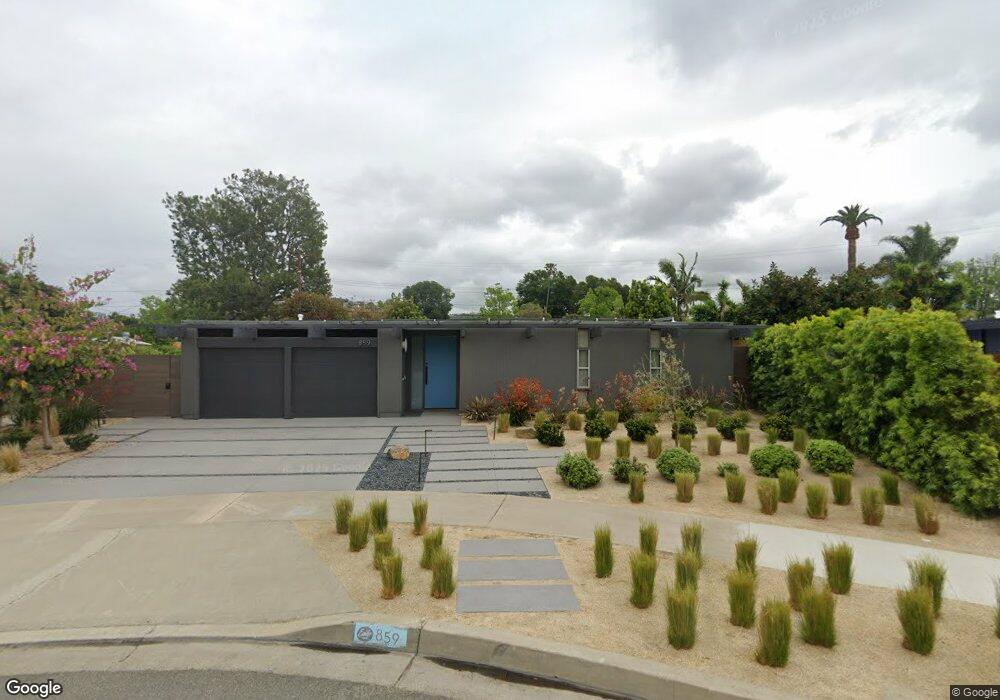
859 S Cedarwood St Orange, CA 92869
Estimated Value: $1,353,000 - $1,802,000
4
Beds
2
Baths
2,260
Sq Ft
$685/Sq Ft
Est. Value
About This Home
This home is located at 859 S Cedarwood St, Orange, CA 92869 and is currently estimated at $1,548,465, approximately $685 per square foot. 859 S Cedarwood St is a home located in Orange County with nearby schools including Jordan Academy of Language & Computer Science, El Modena High School, and Foothill Montessori School, Llc.
Ownership History
Date
Name
Owned For
Owner Type
Purchase Details
Closed on
Mar 24, 2021
Sold by
Ettinger Marc
Bought by
Ettinger Marc and Ettinger Tracy A
Current Estimated Value
Home Financials for this Owner
Home Financials are based on the most recent Mortgage that was taken out on this home.
Original Mortgage
$409,000
Interest Rate
2.73%
Mortgage Type
New Conventional
Purchase Details
Closed on
May 21, 1996
Sold by
Heino Nurmberg and Heino Maie
Bought by
Ettinger Marc and Ettinger Tracy A
Home Financials for this Owner
Home Financials are based on the most recent Mortgage that was taken out on this home.
Original Mortgage
$190,400
Interest Rate
8.09%
Create a Home Valuation Report for This Property
The Home Valuation Report is an in-depth analysis detailing your home's value as well as a comparison with similar homes in the area
Home Values in the Area
Average Home Value in this Area
Purchase History
| Date | Buyer | Sale Price | Title Company |
|---|---|---|---|
| Ettinger Marc | -- | Accommodation | |
| Ettinger Marc | -- | Wfg Title Insurance Company | |
| Ettinger Marc | -- | Wfg Title Insurance Company | |
| Ettinger Marc | $200,500 | Gateway Title |
Source: Public Records
Mortgage History
| Date | Status | Borrower | Loan Amount |
|---|---|---|---|
| Previous Owner | Ettinger Marc | $409,000 | |
| Previous Owner | Ettinger Marc | $190,400 |
Source: Public Records
Tax History Compared to Growth
Tax History
| Year | Tax Paid | Tax Assessment Tax Assessment Total Assessment is a certain percentage of the fair market value that is determined by local assessors to be the total taxable value of land and additions on the property. | Land | Improvement |
|---|---|---|---|---|
| 2025 | $4,430 | $396,704 | $200,946 | $195,758 |
| 2024 | $4,430 | $388,926 | $197,006 | $191,920 |
| 2023 | $4,329 | $381,300 | $193,143 | $188,157 |
| 2022 | $4,243 | $373,824 | $189,356 | $184,468 |
| 2021 | $4,125 | $366,495 | $185,644 | $180,851 |
| 2020 | $4,086 | $362,738 | $183,741 | $178,997 |
| 2019 | $4,035 | $355,626 | $180,138 | $175,488 |
| 2018 | $3,973 | $348,653 | $176,605 | $172,048 |
| 2017 | $3,810 | $341,817 | $173,142 | $168,675 |
| 2016 | $3,737 | $335,115 | $169,747 | $165,368 |
| 2015 | $3,681 | $330,082 | $167,197 | $162,885 |
| 2014 | $3,601 | $323,617 | $163,922 | $159,695 |
Source: Public Records
Map
Nearby Homes
- 18572 Fairhaven Ave
- 13082 Palomar Way
- 3315 E Romelle Ave
- 13021 Hewes Ave
- 17991 Lassen Dr
- 17922 Romelle Ave
- 18831 Winnwood Ln
- 435 S Estate Dr
- 18841 Deep Well Rd
- 13032 Stanton
- 18945 Fowler Ave
- 18812 Oak Ridge Dr
- 411 S Hewes St
- 12254 Circula Panorama
- 12270 Circula Panorama
- 429 S Hill St
- 19031 Fowler Ave
- 269 S Thomas St
- 12284 Circula Panorama
- 12235 Circula Panorama
- 847 S Cedarwood St
- 871 S Cedarwood St
- 852 S Oakwood St
- 840 S Oakwood St
- 872 S Oakwood St
- 883 S Cedarwood St
- 828 S Oakwood St
- 848 S Cedarwood St
- 3838 E Kirkwood Ave
- 884 S Oakwood St
- 872 S Cedarwood St
- 860 S Cedarwood St
- 3826 E Kirkwood Ave
- 816 S Oakwood St
- 3844 E Kirkwood Ave
- 895 S Cedarwood St
- 884 S Cedarwood St
- 896 S Oakwood St
- 3812 E Kirkwood Ave
- 851 S Oakwood St