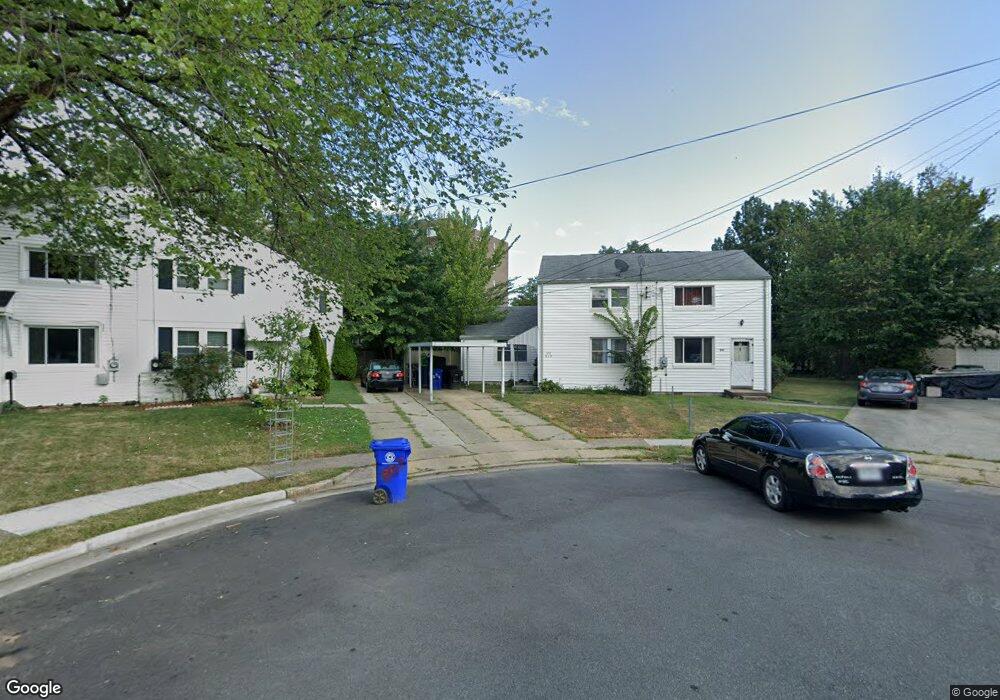
859 S Harrison St Arlington, VA 22204
Arlington Mill NeighborhoodEstimated Value: $530,000 - $610,000
3
Beds
3
Baths
1,207
Sq Ft
$479/Sq Ft
Est. Value
About This Home
This home is located at 859 S Harrison St, Arlington, VA 22204 and is currently estimated at $577,939, approximately $478 per square foot. 859 S Harrison St is a home located in Arlington County with nearby schools including Carlin Springs Elementary School, Kenmore Middle School, and Washington Liberty High School.
Ownership History
Date
Name
Owned For
Owner Type
Purchase Details
Closed on
Jan 30, 2025
Sold by
Tache Sosena T and Tamire Natan N
Bought by
Tamire Natan N
Current Estimated Value
Purchase Details
Closed on
Jan 19, 2012
Sold by
Velasquez Joel E
Bought by
Tache Sosena T and Tamire Natan N
Home Financials for this Owner
Home Financials are based on the most recent Mortgage that was taken out on this home.
Original Mortgage
$8,400
Interest Rate
3.98%
Mortgage Type
Stand Alone Second
Purchase Details
Closed on
Mar 16, 2007
Sold by
Gutierrez Maria
Bought by
Velasquez Joel
Home Financials for this Owner
Home Financials are based on the most recent Mortgage that was taken out on this home.
Original Mortgage
$319,900
Interest Rate
6.4%
Mortgage Type
New Conventional
Purchase Details
Closed on
Feb 28, 2005
Sold by
Phillips Virginia
Bought by
Gutierrez Maria
Home Financials for this Owner
Home Financials are based on the most recent Mortgage that was taken out on this home.
Original Mortgage
$252,000
Interest Rate
5.66%
Mortgage Type
New Conventional
Create a Home Valuation Report for This Property
The Home Valuation Report is an in-depth analysis detailing your home's value as well as a comparison with similar homes in the area
Home Values in the Area
Average Home Value in this Area
Purchase History
| Date | Buyer | Sale Price | Title Company |
|---|---|---|---|
| Tamire Natan N | -- | None Listed On Document | |
| Tache Sosena T | $240,000 | -- | |
| Velasquez Joel | $399,900 | -- | |
| Gutierrez Maria | $315,000 | -- |
Source: Public Records
Mortgage History
| Date | Status | Borrower | Loan Amount |
|---|---|---|---|
| Previous Owner | Tache Sosena T | $8,400 | |
| Previous Owner | Tache Sosena T | $233,916 | |
| Previous Owner | Velasquez Joel | $319,900 | |
| Previous Owner | Gutierrez Maria | $252,000 |
Source: Public Records
Tax History Compared to Growth
Tax History
| Year | Tax Paid | Tax Assessment Tax Assessment Total Assessment is a certain percentage of the fair market value that is determined by local assessors to be the total taxable value of land and additions on the property. | Land | Improvement |
|---|---|---|---|---|
| 2025 | $5,442 | $526,800 | $431,300 | $95,500 |
| 2024 | $5,249 | $508,100 | $421,300 | $86,800 |
| 2023 | $5,179 | $502,800 | $411,300 | $91,500 |
| 2022 | $4,794 | $465,400 | $366,300 | $99,100 |
| 2021 | $4,090 | $397,100 | $298,000 | $99,100 |
| 2020 | $3,872 | $377,400 | $277,800 | $99,600 |
| 2019 | $3,592 | $350,100 | $252,500 | $97,600 |
| 2018 | $3,449 | $342,800 | $242,400 | $100,400 |
| 2017 | $3,295 | $327,500 | $232,300 | $95,200 |
| 2016 | $3,094 | $312,200 | $227,300 | $84,900 |
| 2015 | $2,935 | $294,700 | $222,200 | $72,500 |
| 2014 | $2,814 | $282,500 | $212,100 | $70,400 |
Source: Public Records
Map
Nearby Homes
- 5565 Columbia Pike Unit 412
- 818 S Greenbrier St
- 801 S Greenbrier St Unit 304
- 801 S Greenbrier St Unit 412
- 5300 Columbia Pike Unit 103
- 5300 Columbia Pike Unit 315
- 641 S Greenbrier St
- 5208 10th Place S
- 5402 S 12th St
- 750 S Dickerson St Unit 402
- 750 S Dickerson St Unit 213
- 750 S Dickerson St Unit 4
- 750 S Dickerson St Unit 103
- 5051 7th Rd S Unit 201
- 5041 7th Rd S Unit 102
- 806 S Arlington Mill Dr Unit 104
- 1119 S Edison St
- 5105 11th St S
- 526 S Carlin Springs Rd
- 5427 3rd St S
- 859 S Harrison St
- 857 S Harrison St
- 861 S Harrison St
- 855 S Harrison St
- 863 S Harrison St
- 853 S Harrison St
- 865 S Harrison St
- 851 S Harrison St
- 864 S Harrison St
- 849 S Harrison St
- 756 Carlin Springs Rd
- 5565 Columbia Pike Unit 403
- 5565 Columbia Pike Unit 611
- 5565 Columbia Pike Unit 501
- 5565 Columbia Pike Unit 302
- 5565 Columbia Pike Unit 703
- 5565 Columbia Pike Unit 509
- 5565 Columbia Pike Unit 414
- 5565 Columbia Pike Unit 506
- 5565 Columbia Pike Unit 710