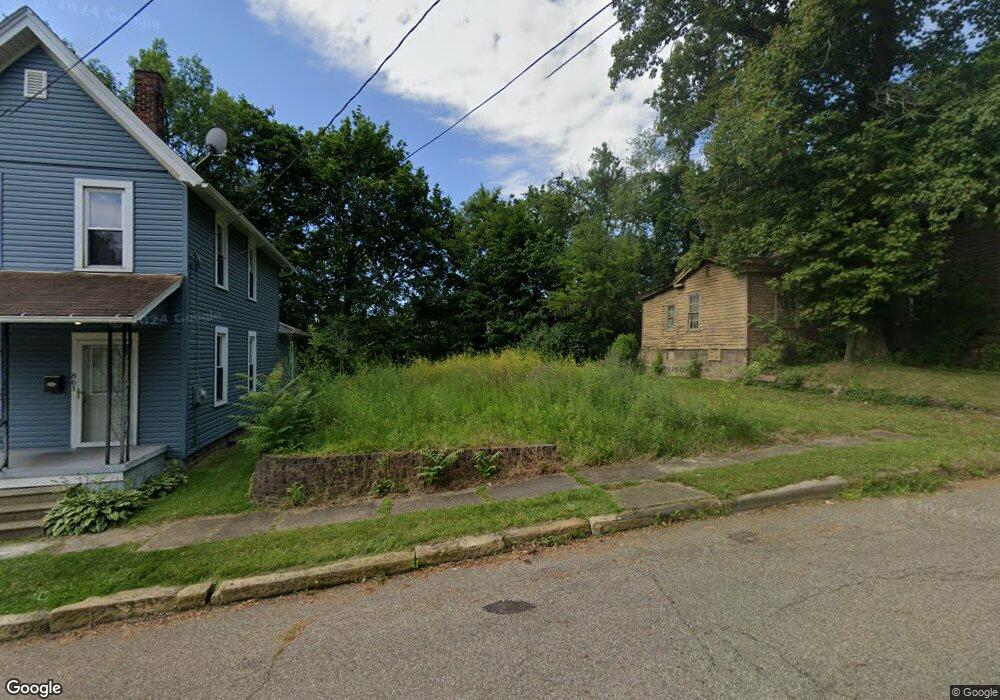
859 South Ave SE Massillon, OH 44646
Downtown Massillon NeighborhoodEstimated Value: $127,000 - $365,000
2
Beds
1
Bath
1,204
Sq Ft
$218/Sq Ft
Est. Value
About This Home
This home is located at 859 South Ave SE, Massillon, OH 44646 and is currently estimated at $262,000, approximately $217 per square foot. 859 South Ave SE is a home located in Stark County with nearby schools including Massillon Intermediate School, Massillon Junior High School, and Washington High School.
Ownership History
Date
Name
Owned For
Owner Type
Purchase Details
Closed on
May 30, 2007
Sold by
Hsbc Mortgage Services Inc
Bought by
Clark Brett
Current Estimated Value
Purchase Details
Closed on
Jan 5, 2007
Sold by
Arndt Kathy M and Arndt Nicolai
Bought by
Hsbc Mortgage Services Inc
Purchase Details
Closed on
Nov 9, 2000
Sold by
Nick Arndt and Nick Nicolai D
Bought by
Arndt Kathy M
Purchase Details
Closed on
Jan 21, 1994
Create a Home Valuation Report for This Property
The Home Valuation Report is an in-depth analysis detailing your home's value as well as a comparison with similar homes in the area
Home Values in the Area
Average Home Value in this Area
Purchase History
| Date | Buyer | Sale Price | Title Company |
|---|---|---|---|
| Clark Brett | $10,900 | Attorney | |
| Hsbc Mortgage Services Inc | $30,000 | None Available | |
| Arndt Kathy M | -- | -- | |
| -- | -- | -- |
Source: Public Records
Tax History Compared to Growth
Tax History
| Year | Tax Paid | Tax Assessment Tax Assessment Total Assessment is a certain percentage of the fair market value that is determined by local assessors to be the total taxable value of land and additions on the property. | Land | Improvement |
|---|---|---|---|---|
| 2025 | $23,808 | $2,730 | $2,730 | -- |
| 2024 | $21,973 | $2,730 | $2,730 | -- |
| 2023 | $21,402 | $2,170 | $2,170 | -- |
| 2022 | $551 | $2,170 | $2,170 | $0 |
| 2021 | $14,102 | $7,700 | $4,340 | $3,360 |
| 2020 | $937 | $10,360 | $3,570 | $6,790 |
| 2019 | $1,264 | $10,360 | $3,570 | $6,790 |
| 2018 | $911 | $10,360 | $3,570 | $6,790 |
| 2017 | $882 | $9,350 | $3,610 | $5,740 |
| 2016 | $856 | $8,970 | $3,610 | $5,360 |
| 2015 | $653 | $8,970 | $3,610 | $5,360 |
| 2014 | $555 | $8,890 | $3,570 | $5,320 |
| 2013 | $557 | $8,890 | $3,570 | $5,320 |
Source: Public Records
Map
Nearby Homes
- 509 Tremont Ave SE
- 652 Young St SE
- 832 Wellman Ave SE
- 637 Wallace Ave SE
- 46 5th St SE
- 202 Rose Ave SE
- 104 Penn Ave SE
- 528 Lincoln Way E
- 1012 Federal Ave NE
- 1319 Walnut Rd SE
- 3476 Joyce Ave NW Unit 15
- 3414 Joyce Ave NW Unit 18
- Lot 42 Joyce Ave NW
- 17 Maple Ave SE
- 227 2nd St NE
- 433 7th St NE
- 313 2nd St NE
- 712 Harmon Place NE
- 1720 Lincoln Way E
- 1112 State Ave NE
- 861 South Ave SE
- 853 South Ave SE
- 2221 Lot South Ave SE
- 858 South Ave SE
- 2222 Lot South Ave SE
- 862 South Ave SE
- 852 South Ave SE
- 846 South Ave SE
- 838 South Ave SE
- 338 11th St SE
- 821 South Ave SE
- 828 South Ave SE
- 817 South Ave SE
- 330 11th St SE
- 813 South Ave SE
- 863 Oak Ave SE
- 863 Oak Ave SE
- 328 11th St SE
- 328 11th St SE
- 849 Oak Ave SE