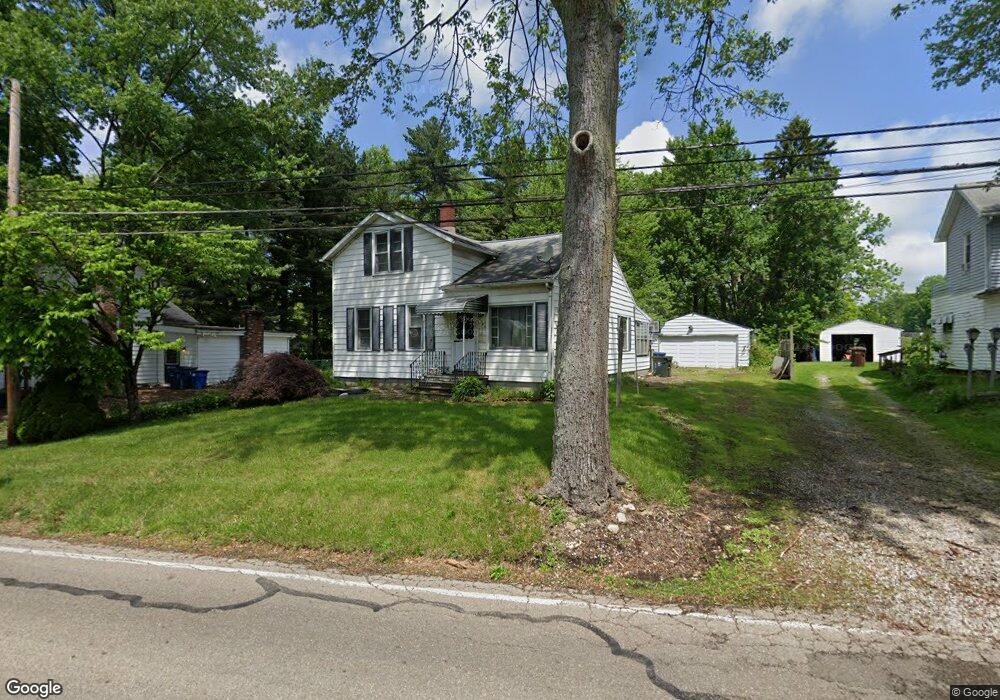
859 W Nimisila Rd New Franklin, OH 44319
Estimated Value: $166,000 - $208,000
3
Beds
1
Bath
936
Sq Ft
$191/Sq Ft
Est. Value
About This Home
This home is located at 859 W Nimisila Rd, New Franklin, OH 44319 and is currently estimated at $178,437, approximately $190 per square foot. 859 W Nimisila Rd is a home located in Summit County with nearby schools including St. Francis de Sales School and SS Philip and James Elementary.
Ownership History
Date
Name
Owned For
Owner Type
Purchase Details
Closed on
Jul 21, 2005
Sold by
Ashley Daniel L and Ashley Vicki E
Bought by
Moore Albert J and Knox Carrie A
Current Estimated Value
Home Financials for this Owner
Home Financials are based on the most recent Mortgage that was taken out on this home.
Original Mortgage
$93,433
Interest Rate
5.74%
Mortgage Type
FHA
Create a Home Valuation Report for This Property
The Home Valuation Report is an in-depth analysis detailing your home's value as well as a comparison with similar homes in the area
Home Values in the Area
Average Home Value in this Area
Purchase History
| Date | Buyer | Sale Price | Title Company |
|---|---|---|---|
| Moore Albert J | $94,900 | First American Title Ins Co |
Source: Public Records
Mortgage History
| Date | Status | Borrower | Loan Amount |
|---|---|---|---|
| Closed | Moore Albert J | $93,433 |
Source: Public Records
Tax History Compared to Growth
Tax History
| Year | Tax Paid | Tax Assessment Tax Assessment Total Assessment is a certain percentage of the fair market value that is determined by local assessors to be the total taxable value of land and additions on the property. | Land | Improvement |
|---|---|---|---|---|
| 2025 | $1,950 | $38,399 | $9,933 | $28,466 |
| 2024 | $1,950 | $38,399 | $9,933 | $28,466 |
| 2023 | $1,950 | $38,399 | $9,933 | $28,466 |
| 2022 | $1,901 | $29,145 | $7,413 | $21,732 |
| 2021 | $1,907 | $29,145 | $7,413 | $21,732 |
| 2020 | $1,912 | $29,140 | $7,410 | $21,730 |
| 2019 | $2,240 | $31,310 | $7,410 | $23,900 |
| 2018 | $1,936 | $31,310 | $7,410 | $23,900 |
| 2017 | $1,870 | $31,310 | $7,410 | $23,900 |
| 2016 | $1,853 | $27,480 | $7,410 | $20,070 |
| 2015 | $1,870 | $27,480 | $7,410 | $20,070 |
| 2014 | $1,858 | $27,480 | $7,410 | $20,070 |
| 2013 | $1,991 | $29,640 | $7,410 | $22,230 |
Source: Public Records
Map
Nearby Homes
- 6090 Manchester Rd Unit 6096
- 5776 Harter Home Dr
- 1062 Stump Rd
- 781 Leeman Dr
- 899 Loway Dr
- 715 Highland Park Dr
- 6387 Hampsher Rd
- 451 Yager Rd
- 5892 Woodward Dr
- 6407 Southview Dr
- 427 Center Rd
- 0 W Comet Rd Unit 5079117
- 7060 Manchester Rd
- S/L 14,15 Shakes Hotel Dr
- 8714 Greenmeadow Ave NW
- 0 Babst Ave NW
- 6 Shrakes Hotel Dr
- 4 Shrakes Hotel Dr
- 7 Shrakes Hotel Dr
- 5 Shrakes Hotel Dr
- 865 W Nimisila Rd
- 871 W Nimisila Rd
- 851 W Nimisila Rd
- 856 W Nimisila Rd
- 848 W Nimisila Rd
- 866 W Nimisila Rd
- 845 W Nimisila Rd
- 872 W Nimisila Rd
- 878 W Nimisila Rd
- 840 W Nimisila Rd
- 837 W Nimisila Rd
- 829 W Nimisila Rd
- 884 W Nimisila Rd
- 891 W Nimisila Rd
- 891 W Nimisila Rd
- 895 W Nimisila Rd
- 895 W Nimisila Rd
- 896 W Nimisila Rd
- 819 W Nimisila Rd
- 911 W Nimisila Rd