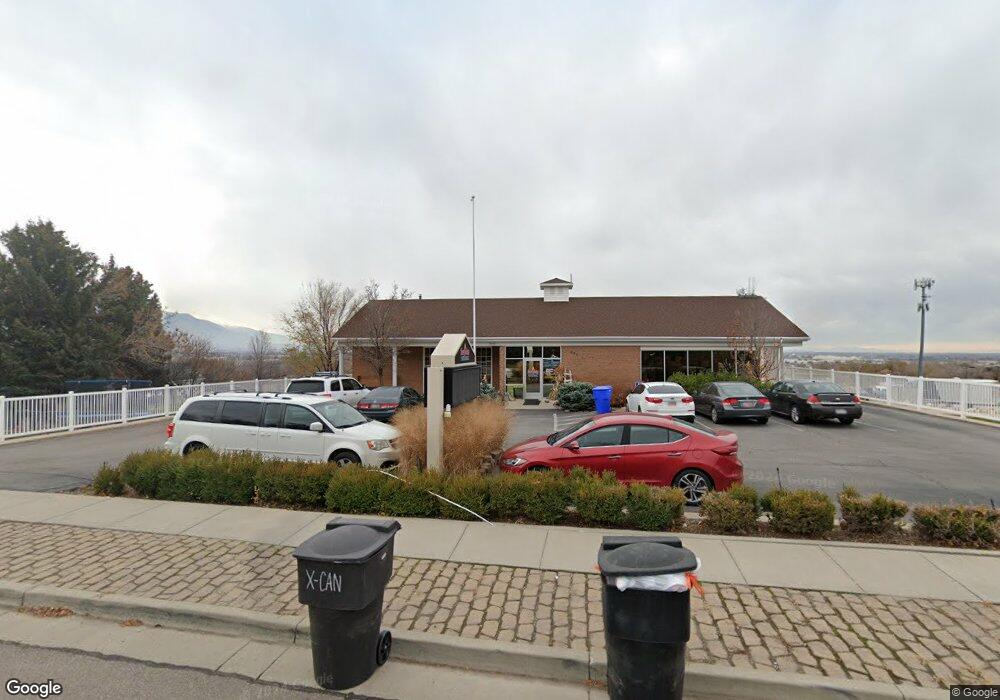
859 W Pleasant View Dr Pleasant View, UT 84414
Estimated Value: $621,146
--
Bed
--
Bath
2,861
Sq Ft
$217/Sq Ft
Est. Value
About This Home
This home is located at 859 W Pleasant View Dr, Pleasant View, UT 84414 and is currently estimated at $621,146, approximately $217 per square foot. 859 W Pleasant View Dr is a home located in Weber County with nearby schools including Orion Junior High School, Weber High School, and Maria Montessori Academy.
Ownership History
Date
Name
Owned For
Owner Type
Purchase Details
Closed on
Dec 29, 2020
Sold by
Webnx Inc
Bought by
Turing Property Management Llc
Current Estimated Value
Purchase Details
Closed on
Apr 25, 2017
Sold by
Hopkins Family Enterprises Llc
Bought by
Webnx Inc
Home Financials for this Owner
Home Financials are based on the most recent Mortgage that was taken out on this home.
Original Mortgage
$200,000
Interest Rate
4.14%
Mortgage Type
New Conventional
Purchase Details
Closed on
Apr 28, 2011
Sold by
Hopkins Enterprises Llc
Bought by
Hopkins Family Enterprises Llc
Purchase Details
Closed on
Mar 7, 2001
Sold by
Select Tech Inc
Bought by
Hopkins Enterprises Llc
Create a Home Valuation Report for This Property
The Home Valuation Report is an in-depth analysis detailing your home's value as well as a comparison with similar homes in the area
Home Values in the Area
Average Home Value in this Area
Purchase History
| Date | Buyer | Sale Price | Title Company |
|---|---|---|---|
| Turing Property Management Llc | -- | None Available | |
| Webnx Inc | -- | Backman Title Services Ltd | |
| Hopkins Family Enterprises Llc | -- | Epek Title Insurance Agency | |
| Hopkins Enterprises Llc | -- | First American Title Ins Age | |
| Select Tech Inc | -- | First American Title Ins Age |
Source: Public Records
Mortgage History
| Date | Status | Borrower | Loan Amount |
|---|---|---|---|
| Previous Owner | Webnx Inc | $200,000 |
Source: Public Records
Tax History Compared to Growth
Tax History
| Year | Tax Paid | Tax Assessment Tax Assessment Total Assessment is a certain percentage of the fair market value that is determined by local assessors to be the total taxable value of land and additions on the property. | Land | Improvement |
|---|---|---|---|---|
| 2025 | $6,572 | $577,000 | $337,444 | $239,556 |
| 2024 | $6,096 | $544,000 | $329,945 | $214,055 |
| 2023 | $5,924 | $531,497 | $164,973 | $366,524 |
| 2022 | $5,561 | $509,000 | $142,476 | $366,524 |
| 2021 | $5,162 | $441,000 | $127,479 | $313,521 |
| 2020 | $5,298 | $420,000 | $97,484 | $322,516 |
| 2019 | $5,281 | $400,000 | $97,484 | $302,516 |
| 2018 | $5,244 | $381,384 | $97,484 | $283,900 |
| 2017 | $4,976 | $341,428 | $97,484 | $243,944 |
| 2016 | $4,901 | $333,929 | $89,985 | $243,944 |
| 2015 | $4,709 | $317,970 | $89,985 | $227,985 |
| 2014 | $4,625 | $307,114 | $89,985 | $217,129 |
Source: Public Records
Map
Nearby Homes
- 0 W Pleasant View Dr
- 735 W 3500 N
- 1012 W 3550 N
- 1023 W 3350 N
- 993 W 3800 N
- 567 W 3650 N
- 3862 N 900 W
- 3875 N 1000 W
- 3011 N 1000 W
- 483 W 3500 N
- 2700 N 600 W
- 3478 N 400 W
- 3414 N 1160 W Unit 214-R
- 2941 Highway 89 Unit 615
- 3171 N 275 W
- Raleigh Traditional Plan at Weber View
- 238 W 3175 N
- 1130 Fawn Dr
- 4050 N 1100 W
- 38 White Barn Dr
- 855 W Pleasant View Dr
- 877 W Pleasant View Dr
- 3401 N 850 W
- 3389 N 850 W
- 860 W Pleasant View Dr
- 879 W Pleasant View Dr
- 854 W Pleasant View Dr
- 850 W Pleasant View Dr
- 850 W Pleasant View Dr
- 835 W Pleasant View Dr
- 880 W Pleasant View Dr
- 3367 N 850 W
- 3386 N 850 W
- 883 W Pleasant Dr
- 883 W Pleasant View Dr
- 820 W Pleasant View Dr
- 3366 N 850 W
- 3361 N 850 W
- 801 W Pleasant View Dr
- 3453 N 800 W