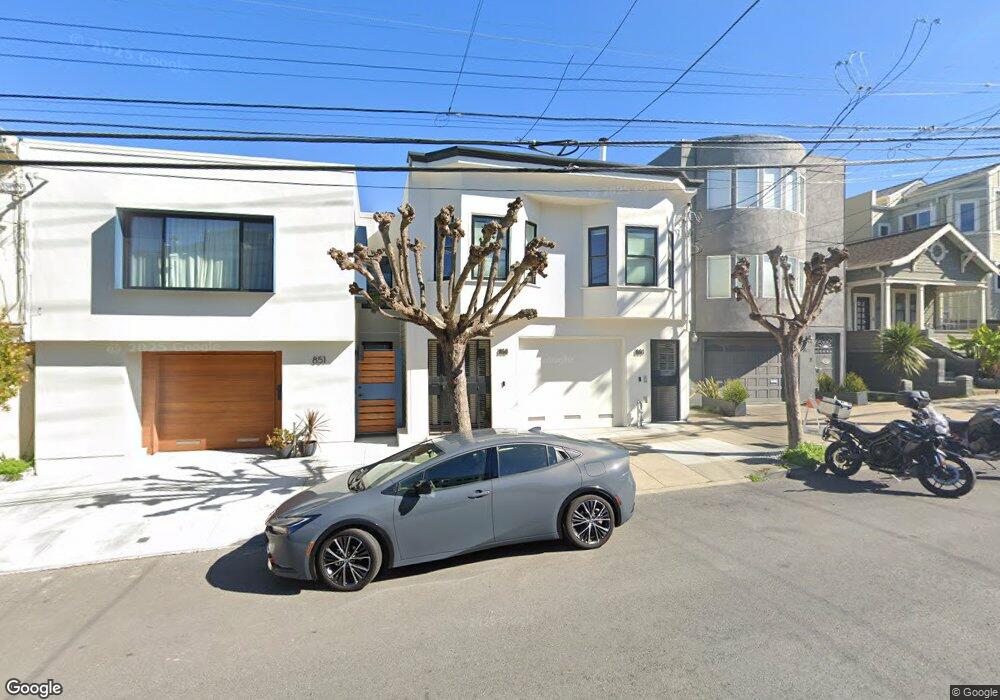
859 Wisconsin St Unit 861 San Francisco, CA 94107
Potrero NeighborhoodEstimated Value: $2,080,000 - $2,488,000
3
Beds
3
Baths
2,199
Sq Ft
$1,021/Sq Ft
Est. Value
About This Home
This home is located at 859 Wisconsin St Unit 861, San Francisco, CA 94107 and is currently estimated at $2,244,480, approximately $1,020 per square foot. 859 Wisconsin St Unit 861 is a home located in San Francisco County with nearby schools including Thomas Starr King Elementary School, Aptos Middle School, and The New School of San Francisco.
Ownership History
Date
Name
Owned For
Owner Type
Purchase Details
Closed on
Jan 14, 2021
Sold by
Bullman Piroon and Bullman Theron
Bought by
Bullman Theron and Bullman Piroon
Current Estimated Value
Home Financials for this Owner
Home Financials are based on the most recent Mortgage that was taken out on this home.
Original Mortgage
$1,500,000
Outstanding Balance
$1,338,755
Interest Rate
2.71%
Mortgage Type
Construction
Estimated Equity
$905,725
Purchase Details
Closed on
Sep 20, 2016
Sold by
Bogan Richard E and 1996 Robert J Flynn Jr Trust
Bought by
Bullman Piroon and Bullman Theron
Purchase Details
Closed on
Aug 24, 2009
Sold by
Flynn Robert J and 1996 Robert J
Bought by
Flynn Robert J and Bogan Richard E
Purchase Details
Closed on
Oct 2, 1996
Sold by
Flynn Robert J and Flynn Roberta M
Bought by
Flynn Robert J and Flynn Roberta M
Create a Home Valuation Report for This Property
The Home Valuation Report is an in-depth analysis detailing your home's value as well as a comparison with similar homes in the area
Home Values in the Area
Average Home Value in this Area
Purchase History
| Date | Buyer | Sale Price | Title Company |
|---|---|---|---|
| Bullman Theron | -- | Chicago Title Company | |
| Bullman Piroon | -- | None Available | |
| Flynn Robert J | -- | None Available | |
| Flynn Robert J | -- | -- |
Source: Public Records
Mortgage History
| Date | Status | Borrower | Loan Amount |
|---|---|---|---|
| Open | Bullman Theron | $1,500,000 |
Source: Public Records
Tax History Compared to Growth
Tax History
| Year | Tax Paid | Tax Assessment Tax Assessment Total Assessment is a certain percentage of the fair market value that is determined by local assessors to be the total taxable value of land and additions on the property. | Land | Improvement |
|---|---|---|---|---|
| 2025 | $23,309 | $1,960,859 | $994,386 | $966,473 |
| 2024 | $23,309 | $1,922,412 | $974,889 | $947,523 |
| 2023 | $22,962 | $1,884,719 | $955,774 | $928,945 |
| 2022 | $21,834 | $1,788,619 | $937,034 | $851,585 |
| 2021 | $16,232 | $1,312,370 | $918,660 | $393,710 |
| 2020 | $16,357 | $1,298,916 | $909,242 | $389,674 |
| 2019 | $15,798 | $1,273,448 | $891,414 | $382,034 |
| 2018 | $15,263 | $1,248,480 | $873,936 | $374,544 |
| 2017 | $1,248 | $69,222 | $22,868 | $46,354 |
| 2016 | $1,110 | $67,866 | $22,420 | $45,446 |
| 2015 | $824 | $66,848 | $22,084 | $44,764 |
| 2014 | $802 | $65,540 | $21,652 | $43,888 |
Source: Public Records
Map
Nearby Homes
- 2023 22nd St
- 1002 Rhode Island St Unit 1
- 2119 22nd St
- 1040 Wisconsin St
- 1225 Rhode Island St
- 573 Connecticut St
- 2225 23rd St Unit 214
- 561 Connecticut St
- 1218 Rhode Island St Unit 5
- 1812 20th St
- 2250 24th St Unit 127
- 666 Carolina St Unit 666
- 1145 Wisconsin St
- 1300 22nd St Unit 220
- 631 Carolina St
- 1336-1338 Rhode Island St
- 700 De Haro St
- 701 Pennsylvania Ave Unit 109
- 701 Pennsylvania Ave Unit 107
- 699 Pennsylvania Ave Unit 2
- 851 Wisconsin St
- 863 Wisconsin St
- 875 Wisconsin St
- 865 Wisconsin St
- 839 Wisconsin St Unit 841
- 839 Wisconsin St Unit 839
- 871 Wisconsin St
- 837 Wisconsin St
- 881 Wisconsin St
- 758 Arkansas St
- 835 Wisconsin St
- 740 Arkansas St
- 738 Arkansas St
- 770 Arkansas St
- 893 Wisconsin St
- 736 Arkansas St
- 776 Arkansas St
- 831 Wisconsin St
- 734 Arkansas St
- 786 Arkansas St