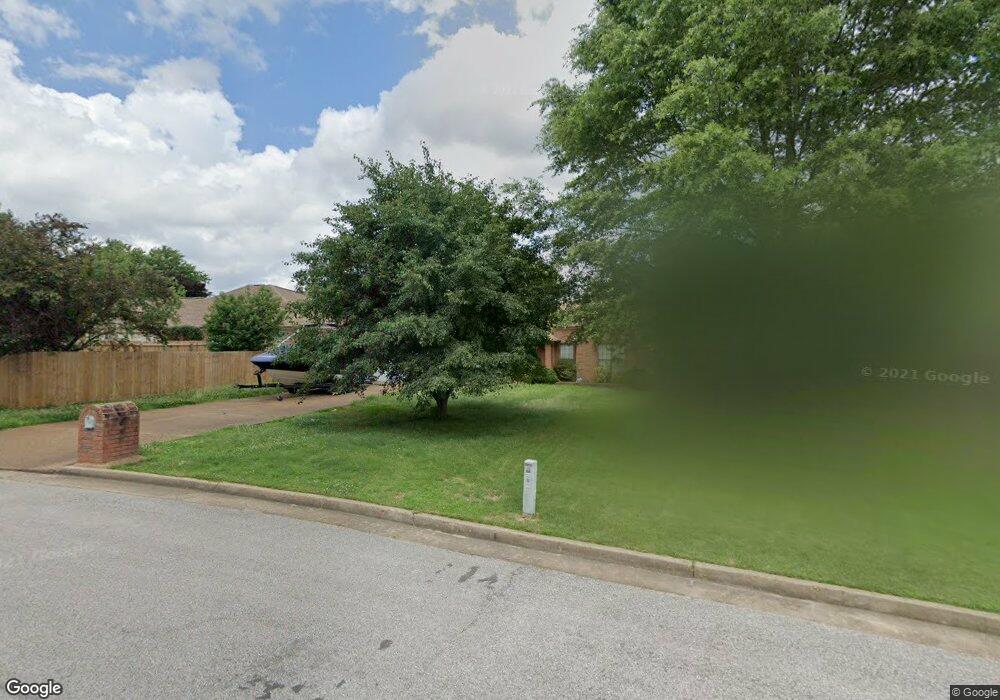
8592 Prism Cove E Cordova, TN 38018
Cordova NeighborhoodEstimated Value: $267,000 - $274,000
3
Beds
2
Baths
1,758
Sq Ft
$154/Sq Ft
Est. Value
About This Home
This home is located at 8592 Prism Cove E, Cordova, TN 38018 and is currently estimated at $270,500, approximately $153 per square foot. 8592 Prism Cove E is a home located in Shelby County with nearby schools including Cordova Elementary School, Cordova Middle School, and Cordova High School.
Ownership History
Date
Name
Owned For
Owner Type
Purchase Details
Closed on
Dec 10, 2016
Sold by
Motamedi Kayhan
Bought by
Motamedi Farhad
Current Estimated Value
Purchase Details
Closed on
Jul 6, 2015
Sold by
Motamedi Farhad
Bought by
Motamedi Kayhan
Purchase Details
Closed on
Feb 21, 2000
Sold by
Steinbach Kyle W and Herman Rs Rs M
Bought by
Motamedi Farhad
Purchase Details
Closed on
Dec 28, 1998
Sold by
Foster Robert B and Foster Paula E
Bought by
Steinbach Kyle W and Herman Tricia M
Home Financials for this Owner
Home Financials are based on the most recent Mortgage that was taken out on this home.
Original Mortgage
$130,150
Interest Rate
6.87%
Purchase Details
Closed on
Jun 10, 1998
Sold by
Williams Derrick D
Bought by
Foster Robert B and Foster Paula E
Home Financials for this Owner
Home Financials are based on the most recent Mortgage that was taken out on this home.
Original Mortgage
$129,675
Interest Rate
7.04%
Create a Home Valuation Report for This Property
The Home Valuation Report is an in-depth analysis detailing your home's value as well as a comparison with similar homes in the area
Home Values in the Area
Average Home Value in this Area
Purchase History
| Date | Buyer | Sale Price | Title Company |
|---|---|---|---|
| Motamedi Farhad | $145,000 | Quality Title Group | |
| Motamedi Kayhan | $20,000 | None Available | |
| Motamedi Farhad | $138,000 | -- | |
| Motamedi Farhad | $138,000 | -- | |
| Steinbach Kyle W | $137,000 | -- | |
| Steinbach Kyle W | $137,000 | -- | |
| Foster Robert B | $136,500 | -- | |
| Foster Robert B | $136,500 | -- |
Source: Public Records
Mortgage History
| Date | Status | Borrower | Loan Amount |
|---|---|---|---|
| Previous Owner | Steinbach Kyle W | $130,150 | |
| Previous Owner | Foster Robert B | $129,675 |
Source: Public Records
Tax History
| Year | Tax Paid | Tax Assessment Tax Assessment Total Assessment is a certain percentage of the fair market value that is determined by local assessors to be the total taxable value of land and additions on the property. | Land | Improvement |
|---|---|---|---|---|
| 2025 | $1,636 | $66,925 | $14,750 | $52,175 |
| 2024 | $1,636 | $48,250 | $8,500 | $39,750 |
| 2023 | $2,939 | $48,250 | $8,500 | $39,750 |
| 2022 | $2,939 | $48,250 | $8,500 | $39,750 |
| 2021 | $2,974 | $48,250 | $8,500 | $39,750 |
| 2020 | $2,632 | $36,325 | $8,500 | $27,825 |
| 2019 | $2,632 | $36,325 | $8,500 | $27,825 |
| 2018 | $2,632 | $36,325 | $8,500 | $27,825 |
| 2017 | $1,493 | $36,325 | $8,500 | $27,825 |
| 2016 | $1,338 | $30,625 | $0 | $0 |
| 2014 | $1,338 | $30,625 | $0 | $0 |
Source: Public Records
Map
Nearby Homes
- 8561 Overcup Oaks Dr
- 8544 Overcup Oaks Dr
- 745 Radiance Dr
- 8610 Trinity Rd
- 8481 Overcup Oaks Dr
- 596 W Ashley Glen Cir
- 624 E Ashley Glen Cir
- 8585 Timber Creek Dr
- 8594 Timber Creek Dr
- 8643 Timber Creek Dr
- 857 Paradise Dr
- 871 Sun Vista Dr E
- 853 Cairn Creek Dr
- 741 N Sanga Rd
- 8524 Shady Elm Dr
- 432 Bruins Trace
- 884 Wood Kirk Cove
- 8502 Griffin Park Dr
- 9385 Greybear Cove
- 470 Walnut Point Cove
- 8596 Prism Cove E
- 686 Radiance Dr
- 8605 Overcup Oaks Dr
- 8599 Overcup Oaks Dr
- 8600 Prism Cove E
- 8611 Overcup Oaks Dr
- 8589 Prism Cove E
- 8595 Prism Cove E
- 683 Radiance Dr
- 693 Radiance Dr
- 8604 Prism Cove E
- 8599 Prism Cove E
- 8603 Prism Cove E
- 699 Radiance Dr
- 673 Radiance Dr
- 689 N Ericson Rd
- 670 Radiance Dr
- 671 N Ericson Rd
- 710 Radiance Dr
- 8612 Overcup Oaks Dr
Your Personal Tour Guide
Ask me questions while you tour the home.