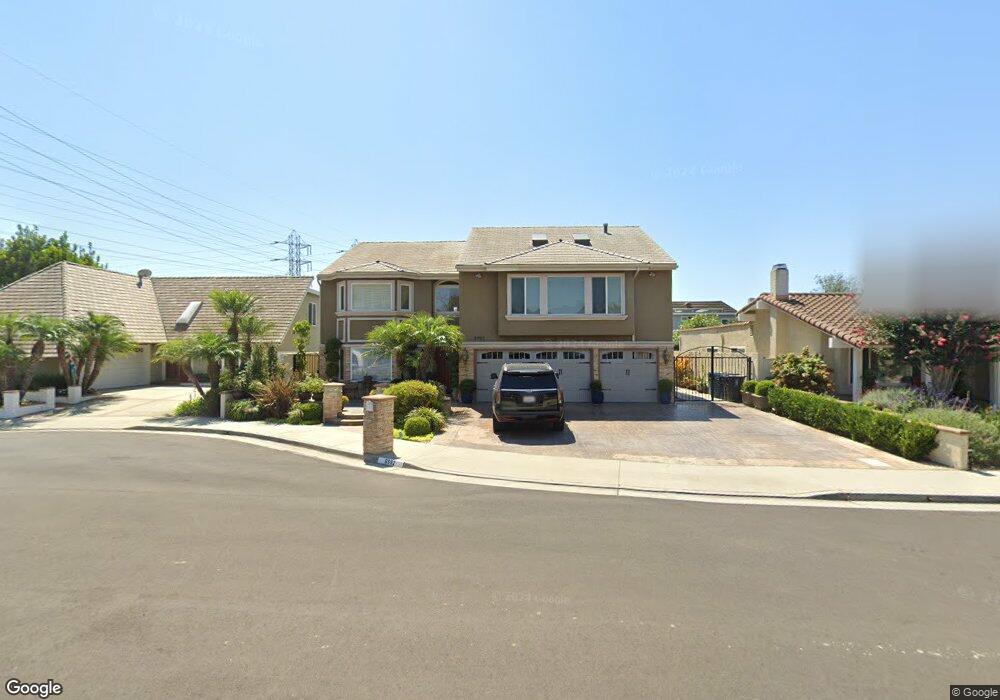
8592 Whitesails Cir Huntington Beach, CA 92646
Estimated Value: $1,587,000 - $2,193,000
4
Beds
3
Baths
3,404
Sq Ft
$543/Sq Ft
Est. Value
About This Home
This home is located at 8592 Whitesails Cir, Huntington Beach, CA 92646 and is currently estimated at $1,849,846, approximately $543 per square foot. 8592 Whitesails Cir is a home located in Orange County with nearby schools including William T. Newland Elementary, Talbert Middle School, and Huntington Beach High School.
Ownership History
Date
Name
Owned For
Owner Type
Purchase Details
Closed on
Sep 26, 2025
Sold by
Gunderson John
Bought by
John Gunderson & Marcia A Gunderson Revocable and Gunderson
Current Estimated Value
Purchase Details
Closed on
May 10, 2010
Sold by
Gunderson John
Bought by
Gunderson John
Home Financials for this Owner
Home Financials are based on the most recent Mortgage that was taken out on this home.
Original Mortgage
$250,000
Interest Rate
5.05%
Mortgage Type
Credit Line Revolving
Purchase Details
Closed on
Jan 5, 2007
Sold by
Gunderson John
Bought by
Gunderson John and The John Gunderson & Marcia A Gunderson
Purchase Details
Closed on
Feb 7, 2006
Sold by
Pitaccio Thomas H and Pitaccio Patricia L
Bought by
Pitaccio Thomas H and Pitaccio Patricia L
Purchase Details
Closed on
Aug 17, 2005
Sold by
Gunderson Jack and Gunderson Marcia
Bought by
Gunderson John and Gunderson Marcia A
Create a Home Valuation Report for This Property
The Home Valuation Report is an in-depth analysis detailing your home's value as well as a comparison with similar homes in the area
Home Values in the Area
Average Home Value in this Area
Purchase History
| Date | Buyer | Sale Price | Title Company |
|---|---|---|---|
| John Gunderson & Marcia A Gunderson Revocable | -- | None Listed On Document | |
| Gunderson John | -- | Ort | |
| Gunderson John | -- | None Available | |
| Pitaccio Thomas H | -- | None Available | |
| Gunderson John | -- | None Available |
Source: Public Records
Mortgage History
| Date | Status | Borrower | Loan Amount |
|---|---|---|---|
| Previous Owner | Gunderson John | $250,000 |
Source: Public Records
Tax History Compared to Growth
Tax History
| Year | Tax Paid | Tax Assessment Tax Assessment Total Assessment is a certain percentage of the fair market value that is determined by local assessors to be the total taxable value of land and additions on the property. | Land | Improvement |
|---|---|---|---|---|
| 2025 | $6,490 | $576,316 | $236,711 | $339,605 |
| 2024 | $6,490 | $565,016 | $232,069 | $332,947 |
| 2023 | $6,336 | $553,938 | $227,519 | $326,419 |
| 2022 | $6,242 | $543,077 | $223,058 | $320,019 |
| 2021 | $6,121 | $532,429 | $218,684 | $313,745 |
| 2020 | $6,084 | $526,970 | $216,442 | $310,528 |
| 2019 | $5,959 | $516,638 | $212,198 | $304,440 |
| 2018 | $5,844 | $506,508 | $208,037 | $298,471 |
| 2017 | $5,750 | $496,577 | $203,958 | $292,619 |
| 2016 | $5,504 | $486,841 | $199,959 | $286,882 |
| 2015 | $5,420 | $479,529 | $196,956 | $282,573 |
| 2014 | $5,312 | $470,136 | $193,098 | $277,038 |
Source: Public Records
Map
Nearby Homes
- 8242 Grant Dr
- 8582 Salt Lake Dr
- 8291 Polk Cir
- 18862 Carolyn Ln
- 19362 Weymouth Ln
- 8120 Islandview Cir Unit C
- 18785 Heavenwood Cir Unit C171
- 18601 Newland St Unit 59
- 18601 Newland St Unit 97
- 18601 Newland St Unit 12
- 18601 Newland St Unit 71
- 18601 Newland St Unit 38
- 18963 Acacia St
- 18566 Santa Andrea St
- 18621 Santa Ramona St
- 8803 Hummingbird Ave
- 18712 Demion Ln
- 18702 Demion Ln
- 18555 Vallarta Dr
- 19321 Beach Blvd
- 8582 Whitesails Cir
- 8612 Whitesails Cir
- 8591 Keel Dr
- 8581 Keel Dr
- 8572 Whitesails Cir
- 8611 Keel Dr
- 8571 Keel Dr
- 8591 Whitesails Cir
- 8581 Whitesails Cir
- 8562 Whitesails Cir
- 8611 Whitesails Cir
- 8561 Keel Dr
- 8571 Whitesails Cir
- 8542 Whitesails Cir
- 8592 Keel Dr
- 8592 Windlass Dr
- 8582 Keel Dr
- 8561 Whitesails Cir
- 8541 Keel Dr
- 8582 Windlass Dr