8595 50th St N Glyndon, MN 56547
Estimated Value: $349,000 - $425,208
4
Beds
2
Baths
1,824
Sq Ft
$214/Sq Ft
Est. Value
About This Home
This home is located at 8595 50th St N, Glyndon, MN 56547 and is currently estimated at $390,802, approximately $214 per square foot. 8595 50th St N is a home located in Clay County with nearby schools including R. Asp Elementary School, Horizon Middle School, and Moorhead High School.
Ownership History
Date
Name
Owned For
Owner Type
Purchase Details
Closed on
Feb 9, 2016
Sold by
Kassenborg Heidi D
Bought by
Kassenborg Trust
Current Estimated Value
Home Financials for this Owner
Home Financials are based on the most recent Mortgage that was taken out on this home.
Original Mortgage
$238,964
Interest Rate
3.88%
Mortgage Type
New Conventional
Purchase Details
Closed on
Dec 18, 2015
Sold by
Fossen Gale and Fossen Janet
Bought by
Gaydos Andrew J and Gaydos Sonya M
Home Financials for this Owner
Home Financials are based on the most recent Mortgage that was taken out on this home.
Original Mortgage
$238,964
Interest Rate
3.88%
Mortgage Type
New Conventional
Create a Home Valuation Report for This Property
The Home Valuation Report is an in-depth analysis detailing your home's value as well as a comparison with similar homes in the area
Home Values in the Area
Average Home Value in this Area
Purchase History
| Date | Buyer | Sale Price | Title Company |
|---|---|---|---|
| Kassenborg Trust | -- | -- | |
| Gaydos Andrew J | $233,000 | Title Co Of Fargo |
Source: Public Records
Mortgage History
| Date | Status | Borrower | Loan Amount |
|---|---|---|---|
| Previous Owner | Gaydos Andrew J | $238,964 |
Source: Public Records
Tax History Compared to Growth
Tax History
| Year | Tax Paid | Tax Assessment Tax Assessment Total Assessment is a certain percentage of the fair market value that is determined by local assessors to be the total taxable value of land and additions on the property. | Land | Improvement |
|---|---|---|---|---|
| 2025 | $3,608 | $390,200 | $77,500 | $312,700 |
| 2024 | $3,608 | $367,400 | $77,500 | $289,900 |
| 2023 | $3,320 | $327,500 | $77,500 | $250,000 |
| 2022 | $3,068 | $316,800 | $77,500 | $239,300 |
| 2021 | $3,084 | $267,600 | $77,500 | $190,100 |
| 2020 | $2,986 | $262,100 | $77,500 | $184,600 |
| 2019 | $2,786 | $263,300 | $77,500 | $185,800 |
| 2018 | $2,496 | $264,500 | $77,500 | $187,000 |
| 2017 | $1,698 | $238,600 | $77,500 | $161,100 |
| 2016 | $1,700 | $175,200 | $52,000 | $123,200 |
| 2015 | $1,426 | $159,500 | $46,800 | $112,700 |
| 2014 | $1,588 | $159,500 | $46,800 | $112,700 |
Source: Public Records
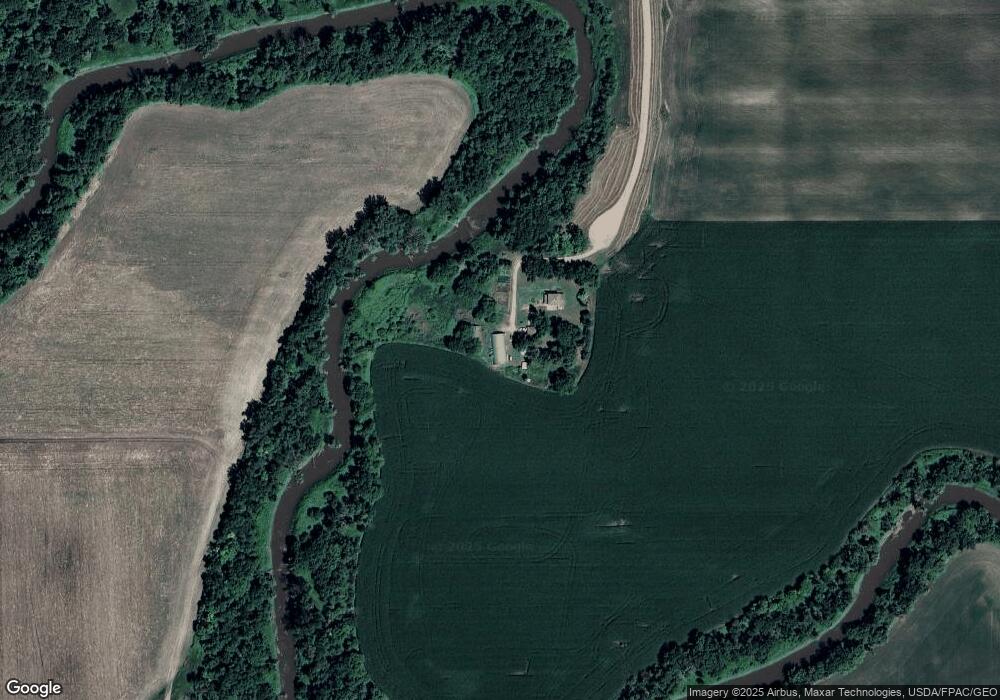
Map
Nearby Homes