85R Summer St Hingham, MA 02043
Estimated Value: $1,032,697 - $1,215,000
3
Beds
2
Baths
1,503
Sq Ft
$762/Sq Ft
Est. Value
About This Home
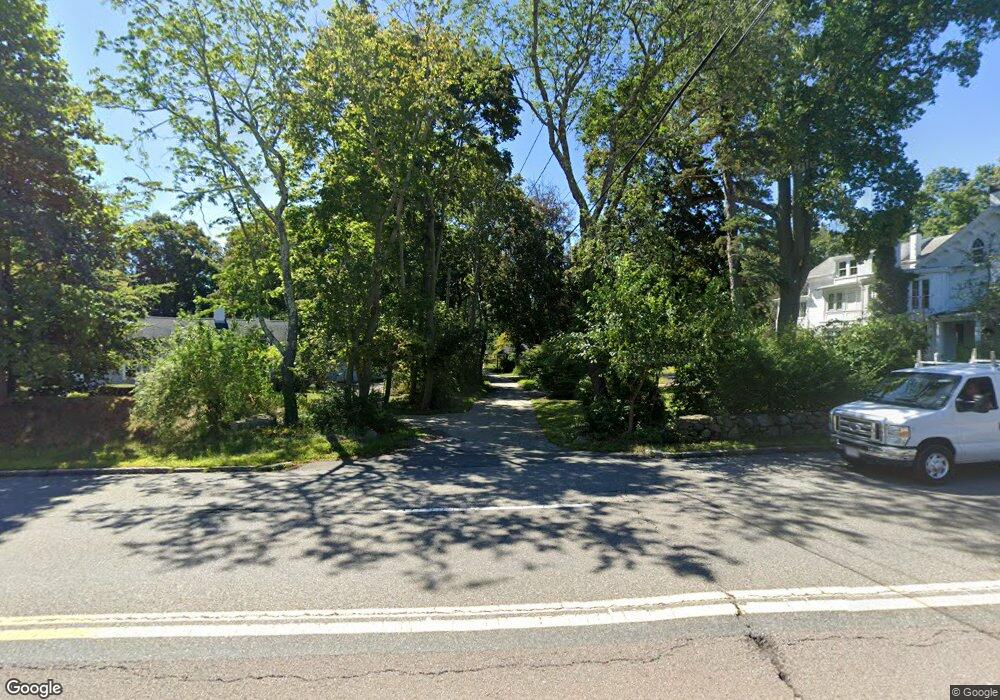
This home is located at 85R Summer St, Hingham, MA 02043 and is currently estimated at $1,144,674, approximately $761 per square foot. 85R Summer St is a home with nearby schools including East Elementary School, Hingham Middle School, and Hingham High School.
Ownership History
Date
Name
Owned For
Owner Type
Purchase Details
Closed on
Mar 30, 2017
Sold by
85 Summer Street Llc
Bought by
Terreri Adam and Terreri Margaret
Current Estimated Value
Home Financials for this Owner
Home Financials are based on the most recent Mortgage that was taken out on this home.
Original Mortgage
$596,000
Outstanding Balance
$488,312
Interest Rate
3.66%
Mortgage Type
New Conventional
Estimated Equity
$656,362
Purchase Details
Closed on
Aug 19, 2016
Sold by
Michele Tornabene Ret
Bought by
85 Summer Street Llc
Purchase Details
Closed on
May 6, 2016
Sold by
Lorraine M Tornabene R
Bought by
Michele Tornabene Ret
Purchase Details
Closed on
Mar 14, 2011
Sold by
Lorraine M Tornabene R and Tornabene Lorraine M
Bought by
Tornabene Michele L
Purchase Details
Closed on
Nov 17, 2010
Sold by
Tornabene Lorraine M
Bought by
Lorraine M Tornabene R and Tornabene Michelle L
Purchase Details
Closed on
Oct 7, 1969
Bought by
Tornabene Michele L
Create a Home Valuation Report for This Property
The Home Valuation Report is an in-depth analysis detailing your home's value as well as a comparison with similar homes in the area
Purchase History
| Date | Buyer | Sale Price | Title Company |
|---|---|---|---|
| Terreri Adam | $745,000 | -- | |
| 85 Summer Street Llc | $500,000 | -- | |
| Michele Tornabene Ret | -- | -- | |
| Michele Tornabene Ret | -- | -- | |
| Tornabene Michele L | -- | -- | |
| Lorraine M Tornabene R | -- | -- | |
| Tornabene Michele L | -- | -- |
Source: Public Records
Mortgage History
| Date | Status | Borrower | Loan Amount |
|---|---|---|---|
| Open | Terreri Adam | $596,000 |
Source: Public Records
Tax History
| Year | Tax Paid | Tax Assessment Tax Assessment Total Assessment is a certain percentage of the fair market value that is determined by local assessors to be the total taxable value of land and additions on the property. | Land | Improvement |
|---|---|---|---|---|
| 2025 | $10,580 | $989,700 | $624,300 | $365,400 |
| 2024 | $10,314 | $950,600 | $624,300 | $326,300 |
| 2023 | $9,204 | $920,400 | $624,300 | $296,100 |
| 2022 | $9,324 | $806,600 | $563,500 | $243,100 |
| 2021 | $8,885 | $753,000 | $541,800 | $211,200 |
| 2020 | $8,682 | $753,000 | $541,800 | $211,200 |
| 2019 | $8,683 | $735,200 | $541,800 | $193,400 |
| 2018 | $8,922 | $758,000 | $541,800 | $216,200 |
| 2017 | $8,505 | $694,300 | $563,500 | $130,800 |
| 2016 | $8,750 | $700,600 | $536,500 | $164,100 |
| 2015 | $8,451 | $674,500 | $510,400 | $164,100 |
Source: Public Records
Map
Nearby Homes
Your Personal Tour Guide
Ask me questions while you tour the home.