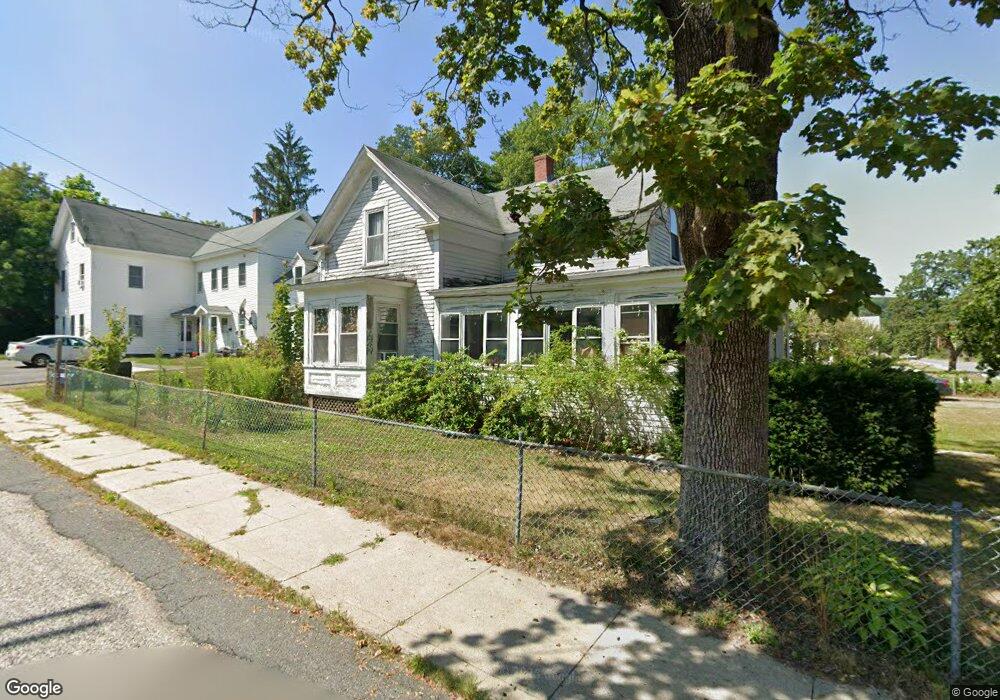
86 Cheney St Orange, MA 01364
Estimated Value: $232,000 - $367,000
3
Beds
2
Baths
1,590
Sq Ft
$179/Sq Ft
Est. Value
About This Home
This home is located at 86 Cheney St, Orange, MA 01364 and is currently estimated at $284,634, approximately $179 per square foot. 86 Cheney St is a home located in Franklin County with nearby schools including Fisher Hill and Ralph C Mahar Regional School.
Ownership History
Date
Name
Owned For
Owner Type
Purchase Details
Closed on
Oct 16, 2002
Sold by
Leslie Ann M and Leslie Wilred
Bought by
Delvental Ceil E
Current Estimated Value
Home Financials for this Owner
Home Financials are based on the most recent Mortgage that was taken out on this home.
Original Mortgage
$117,161
Interest Rate
6.18%
Mortgage Type
Purchase Money Mortgage
Purchase Details
Closed on
Oct 5, 1993
Sold by
Grasso Robert F and Grasso Virginia J
Bought by
Leslie Wilfred and Leslie Ann M
Create a Home Valuation Report for This Property
The Home Valuation Report is an in-depth analysis detailing your home's value as well as a comparison with similar homes in the area
Home Values in the Area
Average Home Value in this Area
Purchase History
| Date | Buyer | Sale Price | Title Company |
|---|---|---|---|
| Delvental Ceil E | $119,000 | -- | |
| Leslie Wilfred | $65,000 | -- |
Source: Public Records
Mortgage History
| Date | Status | Borrower | Loan Amount |
|---|---|---|---|
| Open | Leslie Wilfred | $160,580 | |
| Closed | Leslie Wilfred | $36,749 | |
| Closed | Leslie Wilfred | $117,161 | |
| Previous Owner | Leslie Wilfred | $8,000 |
Source: Public Records
Tax History
| Year | Tax Paid | Tax Assessment Tax Assessment Total Assessment is a certain percentage of the fair market value that is determined by local assessors to be the total taxable value of land and additions on the property. | Land | Improvement |
|---|---|---|---|---|
| 2025 | $39 | $239,500 | $23,000 | $216,500 |
| 2024 | $3,716 | $213,100 | $23,000 | $190,100 |
| 2023 | $3,330 | $185,400 | $20,700 | $164,700 |
| 2022 | $3,008 | $157,300 | $20,700 | $136,600 |
| 2021 | $3,038 | $151,500 | $41,800 | $109,700 |
| 2020 | $2,895 | $142,400 | $38,100 | $104,300 |
| 2019 | $2,849 | $126,500 | $33,000 | $93,500 |
| 2018 | $2,545 | $116,000 | $30,800 | $85,200 |
| 2017 | $2,463 | $116,000 | $30,800 | $85,200 |
| 2016 | $2,311 | $106,500 | $27,500 | $79,000 |
| 2015 | $2,324 | $111,900 | $29,300 | $82,600 |
| 2014 | $2,377 | $120,400 | $29,300 | $91,100 |
Source: Public Records
Map
Nearby Homes
- 270 S Main St
- 12-14 E Main St
- 58 E Main St
- 50 E Main St
- 83 W Main St
- 36 Summit St Unit A
- 36 Summit St Unit B
- 222 W River St
- 35 Ball St
- 166-168 W Main St
- 39 Terrace St
- 23 E Howe St
- 56 Shelter St
- 490 S Main St
- 00 S Main St
- 000 S Main St
- 216 Holtshire Rd
- 0 Quabbin Blvd
- 549 E Main St
- 246 Holtshire Rd Unit Lot 3
- 0 Cheney St
- 36 Congress St Unit 40
- 85 Cheney St
- 75 Cheney St
- 71 Cheney St
- 18 Congress St
- 100 Cheney St Unit 102
- 52 Congress St
- 77 Pleasant St
- 73-75 Pleasant St
- 85 Pleasant St
- 47 Congress St
- 106 Cheney St
- 67 Pleasant St
- 73 Pleasant St
- 142 S Main St
- 53 Congress St
- 0 Congress St
- 136 S Main St
- 112 Cheney St
Your Personal Tour Guide
Ask me questions while you tour the home.