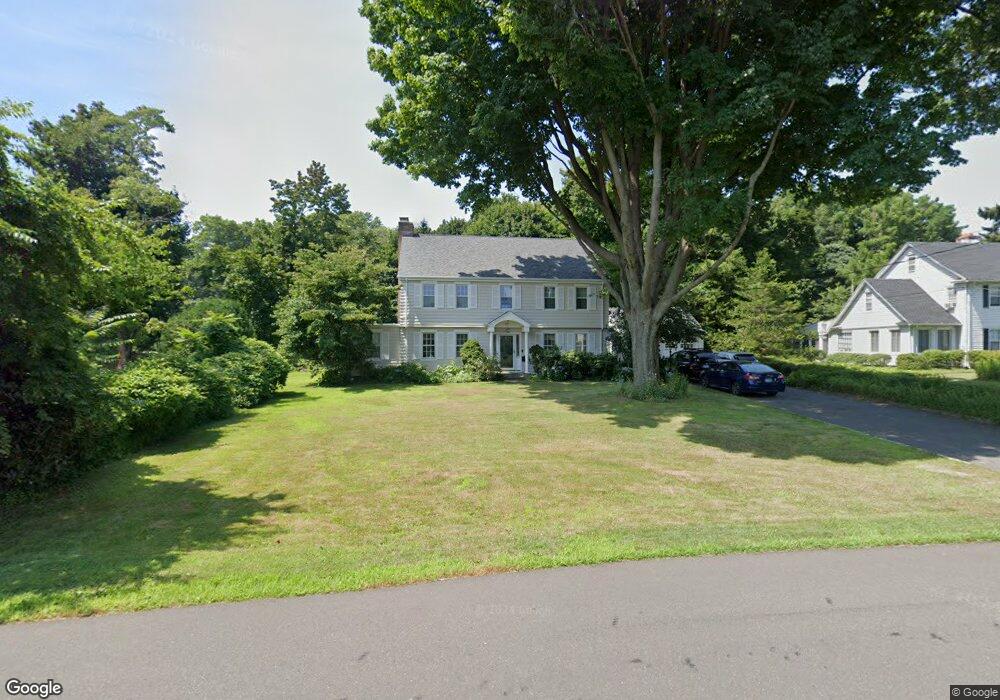
86 Elm St Fairfield, CT 06824
Fairfield Center NeighborhoodEstimated Value: $1,087,000 - $1,253,047
3
Beds
3
Baths
2,416
Sq Ft
$489/Sq Ft
Est. Value
About This Home
This home is located at 86 Elm St, Fairfield, CT 06824 and is currently estimated at $1,182,512, approximately $489 per square foot. 86 Elm St is a home located in Fairfield County with nearby schools including Osborn Hill Elementary School, Fairfield Woods Middle School, and Fairfield Ludlowe High School.
Ownership History
Date
Name
Owned For
Owner Type
Purchase Details
Closed on
Jun 25, 2021
Sold by
Donohue Peter
Bought by
Donohue Peter and Donohue Chaweewan
Current Estimated Value
Home Financials for this Owner
Home Financials are based on the most recent Mortgage that was taken out on this home.
Original Mortgage
$532,527
Interest Rate
2.2%
Mortgage Type
New Conventional
Purchase Details
Closed on
Sep 10, 1999
Sold by
Palazzo John M and Palazzo Sarah T
Bought by
Donohue Peter G and Donohue Claire S
Purchase Details
Closed on
May 21, 1993
Sold by
Kerr Cynthia L and Kerr Gavin R
Bought by
Palazzo John M
Purchase Details
Closed on
Dec 15, 1989
Sold by
Benson Ruth A Est
Bought by
Kerr Gavin R
Create a Home Valuation Report for This Property
The Home Valuation Report is an in-depth analysis detailing your home's value as well as a comparison with similar homes in the area
Home Values in the Area
Average Home Value in this Area
Purchase History
| Date | Buyer | Sale Price | Title Company |
|---|---|---|---|
| Donohue Peter | -- | None Available | |
| Donohue Peter | -- | None Available | |
| Donohue Peter G | $551,500 | -- | |
| Donohue Peter G | $551,500 | -- | |
| Palazzo John M | $341,250 | -- | |
| Palazzo John M | $341,250 | -- | |
| Kerr Gavin R | $267,500 | -- |
Source: Public Records
Mortgage History
| Date | Status | Borrower | Loan Amount |
|---|---|---|---|
| Previous Owner | Donohue Peter | $532,527 | |
| Previous Owner | Kerr Gavin R | $597,272 | |
| Previous Owner | Kerr Gavin R | $612,500 |
Source: Public Records
Tax History
| Year | Tax Paid | Tax Assessment Tax Assessment Total Assessment is a certain percentage of the fair market value that is determined by local assessors to be the total taxable value of land and additions on the property. | Land | Improvement |
|---|---|---|---|---|
| 2025 | $14,094 | $496,440 | $324,870 | $171,570 |
| 2024 | $13,851 | $496,440 | $324,870 | $171,570 |
| 2023 | $13,657 | $496,440 | $324,870 | $171,570 |
| 2022 | $13,523 | $496,440 | $324,870 | $171,570 |
| 2021 | $13,394 | $496,440 | $324,870 | $171,570 |
| 2020 | $13,858 | $517,300 | $321,440 | $195,860 |
| 2019 | $13,858 | $517,300 | $321,440 | $195,860 |
| 2018 | $13,636 | $517,300 | $321,440 | $195,860 |
| 2017 | $13,357 | $517,300 | $321,440 | $195,860 |
| 2016 | $13,165 | $517,300 | $321,440 | $195,860 |
| 2015 | $13,003 | $524,510 | $338,520 | $185,990 |
| 2014 | $12,798 | $524,510 | $338,520 | $185,990 |
Source: Public Records
Map
Nearby Homes
- 20 Ermine St
- 164 Wakeman Rd
- 245 Unquowa Rd Unit 2
- 245 Unquowa Rd Unit 82
- 245 Unquowa Rd Unit 6
- 15 Barton Rd
- 77 Meadowbrook Rd
- 98 Cambridge St
- 855 Riverside Dr
- 1091 Round Hill Rd
- 1478 Jennings Rd
- 70 Meadow Ridge Rd
- 1353 Mill Plain Rd
- 598 S Benson Rd
- 65 Thorpe St Unit 65
- 341 Crestwood Rd
- 345 Reef Rd Unit B6
- 345 Reef Rd Unit C9
- 25 Helen St
- 378 Penfield Rd
Your Personal Tour Guide
Ask me questions while you tour the home.