
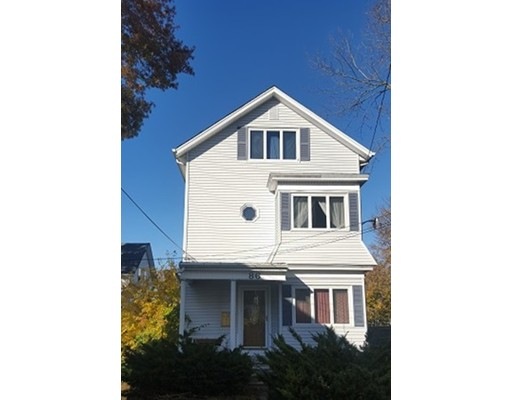
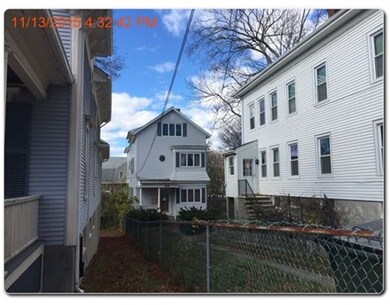
86 Hanover St Fall River, MA 02720
Bank Street Neighborhood
9
Beds
3
Baths
2,652
Sq Ft
4,356
Sq Ft Lot
About This Home
As of August 2019North End Three Family property. Property is set-back off the street. Property offers 3 bedrooms units, open floor plan for each unit with great possibilities. Do not wait on this one. PLEASE SEE FIRM REMARKS FOR OFFER SUBMISSION.
Last Buyer's Agent
William Cabeceiras
Coldwell Banker Realty - Easton License #453500910
Property Details
Home Type
Multi-Family
Est. Annual Taxes
$5,407
Year Built
1900
Lot Details
0
Listing Details
- Lot Description: Paved Drive
- Other Agent: 1.00
- Special Features: 20
- Property Sub Type: MultiFamily
- Year Built: 1900
Interior Features
- Has Basement: Yes
- Number of Rooms: 18
Exterior Features
- Roof: Asphalt/Fiberglass Shingles
- Construction: Frame
- Exterior: Vinyl
- Foundation: Other (See Remarks)
Garage/Parking
- Parking: Off-Street
Utilities
- Sewer: City/Town Sewer
- Water: City/Town Water
Condo/Co-op/Association
- Total Units: 3
Lot Info
- Assessor Parcel Number: M:0M-26 B:0000 L:0036
- Zoning: G
Multi Family
- Total Bedrooms: 9
- Total Floors: 6
- Total Full Baths: 3
- Total Levels: 3
- Total Rms: 18
Ownership History
Date
Name
Owned For
Owner Type
Purchase Details
Closed on
Oct 9, 2015
Sold by
Pasternak Carl and Cit Bank Na
Bought by
Wells Fargo Bank Na Tr
Current Estimated Value
Purchase Details
Closed on
Nov 7, 1994
Sold by
Pasternak David and Letendre Karen
Bought by
Pasternak Peter and Pasternak Jeannine
Home Financials for this Owner
Home Financials are based on the most recent Mortgage that was taken out on this home.
Original Mortgage
$30,000
Interest Rate
8.71%
Mortgage Type
Purchase Money Mortgage
Similar Home in Fall River, MA
Create a Home Valuation Report for This Property
The Home Valuation Report is an in-depth analysis detailing your home's value as well as a comparison with similar homes in the area
Home Values in the Area
Average Home Value in this Area
Purchase History
| Date | Type | Sale Price | Title Company |
|---|---|---|---|
| Foreclosure Deed | $160,000 | -- | |
| Deed | $13,785 | -- |
Source: Public Records
Mortgage History
| Date | Status | Loan Amount | Loan Type |
|---|---|---|---|
| Open | $37,998 | Second Mortgage Made To Cover Down Payment | |
| Open | $289,656 | FHA | |
| Closed | $96,000 | New Conventional | |
| Previous Owner | $412,500 | No Value Available | |
| Previous Owner | $80,000 | No Value Available | |
| Previous Owner | $40,000 | No Value Available | |
| Previous Owner | $30,000 | Purchase Money Mortgage | |
| Previous Owner | $26,100 | No Value Available |
Source: Public Records
Property History
| Date | Event | Price | Change | Sq Ft Price |
|---|---|---|---|---|
| 08/19/2019 08/19/19 | Sold | $295,000 | -1.3% | $111 / Sq Ft |
| 06/28/2019 06/28/19 | Pending | -- | -- | -- |
| 06/19/2019 06/19/19 | Price Changed | $298,900 | -0.3% | $113 / Sq Ft |
| 05/24/2019 05/24/19 | Price Changed | $299,900 | -4.8% | $113 / Sq Ft |
| 05/17/2019 05/17/19 | Price Changed | $314,900 | -1.6% | $119 / Sq Ft |
| 05/17/2019 05/17/19 | For Sale | $319,900 | 0.0% | $121 / Sq Ft |
| 05/14/2019 05/14/19 | Pending | -- | -- | -- |
| 04/23/2019 04/23/19 | Price Changed | $319,900 | -3.0% | $121 / Sq Ft |
| 03/30/2019 03/30/19 | Price Changed | $329,900 | -9.6% | $124 / Sq Ft |
| 03/13/2019 03/13/19 | Price Changed | $364,900 | -2.7% | $138 / Sq Ft |
| 03/05/2019 03/05/19 | For Sale | $374,900 | +212.4% | $141 / Sq Ft |
| 03/11/2016 03/11/16 | Sold | $120,000 | 0.0% | $45 / Sq Ft |
| 01/11/2016 01/11/16 | Pending | -- | -- | -- |
| 12/11/2015 12/11/15 | For Sale | $120,000 | 0.0% | $45 / Sq Ft |
| 12/09/2015 12/09/15 | Pending | -- | -- | -- |
| 11/24/2015 11/24/15 | For Sale | $120,000 | -- | $45 / Sq Ft |
Source: MLS Property Information Network (MLS PIN)
Tax History Compared to Growth
Tax History
| Year | Tax Paid | Tax Assessment Tax Assessment Total Assessment is a certain percentage of the fair market value that is determined by local assessors to be the total taxable value of land and additions on the property. | Land | Improvement |
|---|---|---|---|---|
| 2025 | $5,407 | $472,200 | $114,600 | $357,600 |
| 2024 | $5,207 | $453,200 | $112,300 | $340,900 |
| 2023 | $4,560 | $371,600 | $101,200 | $270,400 |
| 2022 | $3,777 | $322,900 | $95,500 | $227,400 |
| 2021 | $3,777 | $273,100 | $91,200 | $181,900 |
| 2020 | $3,438 | $237,900 | $87,100 | $150,800 |
| 2019 | $3,009 | $206,400 | $91,000 | $115,400 |
| 2018 | $2,719 | $186,000 | $91,700 | $94,300 |
| 2017 | $2,604 | $186,000 | $91,700 | $94,300 |
| 2016 | $2,541 | $186,400 | $94,500 | $91,900 |
| 2015 | $2,438 | $186,400 | $94,500 | $91,900 |
| 2014 | $2,454 | $195,100 | $94,500 | $100,600 |
Source: Public Records
Agents Affiliated with this Home
-
Charles O'Gara
Seller's Agent in 2019
Charles O'Gara
Amaral & Associates RE
(508) 415-8984
2 in this area
36 Total Sales
-
Yvonne Pina
Buyer's Agent in 2019
Yvonne Pina
Pina & Savage Realty Inc.
(508) 930-4625
1 in this area
78 Total Sales
-
Clifford Ponte
Seller's Agent in 2016
Clifford Ponte
Keller Williams South Watuppa
(508) 642-4802
4 in this area
481 Total Sales
-
W
Buyer's Agent in 2016
William Cabeceiras
Coldwell Banker Realty - Easton
Map
Source: MLS Property Information Network (MLS PIN)
MLS Number: 71935913
APN: FALL-000026M-000000-000036
Disclaimer: Certain information contained herein is derived from information provided by parties other than Homes.com. All information provided is deemed reliable, but is not guaranteed to be accurate and should be independently verified.
![]() The property listing data and information, or the Images, set forth herein were provided to MLS Property Information Network, Inc. from third party sources, including sellers, lessors and public records, and were compiled by MLS Property Information Network, Inc. The property listing data and information, and the Images, are for the personal, non-commercial use of consumers having a good faith interest in purchasing or leasing listed properties of the type displayed to them and may not be used for any purpose other than to identify prospective properties which such consumers may have a good faith interest in purchasing or leasing. MLS Property Information Network, Inc. and its subscribers disclaim any and all representations and warranties as to the accuracy of the property listing data and information, or as to the accuracy of any of the Images, set forth herein.
The property listing data and information, or the Images, set forth herein were provided to MLS Property Information Network, Inc. from third party sources, including sellers, lessors and public records, and were compiled by MLS Property Information Network, Inc. The property listing data and information, and the Images, are for the personal, non-commercial use of consumers having a good faith interest in purchasing or leasing listed properties of the type displayed to them and may not be used for any purpose other than to identify prospective properties which such consumers may have a good faith interest in purchasing or leasing. MLS Property Information Network, Inc. and its subscribers disclaim any and all representations and warranties as to the accuracy of the property listing data and information, or as to the accuracy of any of the Images, set forth herein.
Nearby Homes