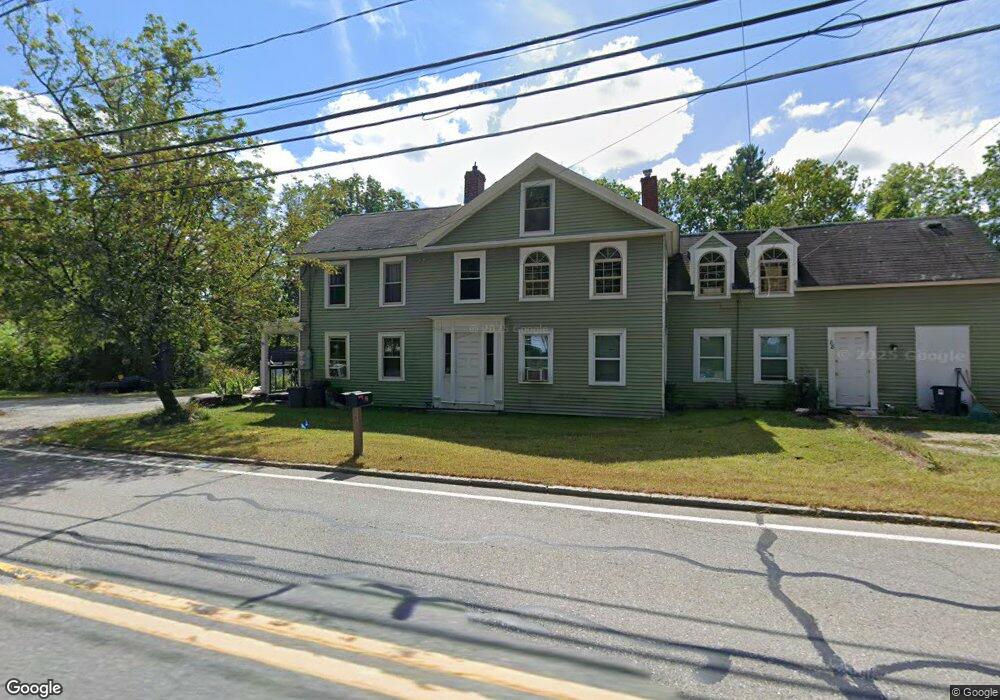
86 Main St Unit 88 Townsend, MA 01469
Estimated Value: $354,209 - $676,000
6
Beds
2
Baths
2,945
Sq Ft
$175/Sq Ft
Est. Value
About This Home
This home is located at 86 Main St Unit 88, Townsend, MA 01469 and is currently estimated at $514,802, approximately $174 per square foot. 86 Main St Unit 88 is a home located in Middlesex County with nearby schools including North Middlesex Regional High School.
Ownership History
Date
Name
Owned For
Owner Type
Purchase Details
Closed on
Apr 19, 2018
Sold by
Dickerson John Henry E
Bought by
Staples Jean E and Staples Jason R
Current Estimated Value
Purchase Details
Closed on
Sep 22, 1993
Sold by
Amadon Richard H and Amadon Ellen
Bought by
Dickerson John H and Dickerson Mildred E
Home Financials for this Owner
Home Financials are based on the most recent Mortgage that was taken out on this home.
Original Mortgage
$65,800
Interest Rate
7.1%
Mortgage Type
Purchase Money Mortgage
Create a Home Valuation Report for This Property
The Home Valuation Report is an in-depth analysis detailing your home's value as well as a comparison with similar homes in the area
Home Values in the Area
Average Home Value in this Area
Purchase History
| Date | Buyer | Sale Price | Title Company |
|---|---|---|---|
| Staples Jean E | -- | -- | |
| Dickerson John H | $94,000 | -- |
Source: Public Records
Mortgage History
| Date | Status | Borrower | Loan Amount |
|---|---|---|---|
| Previous Owner | Dickerson John H | $65,800 |
Source: Public Records
Tax History Compared to Growth
Tax History
| Year | Tax Paid | Tax Assessment Tax Assessment Total Assessment is a certain percentage of the fair market value that is determined by local assessors to be the total taxable value of land and additions on the property. | Land | Improvement |
|---|---|---|---|---|
| 2025 | $4,069 | $280,200 | $55,300 | $224,900 |
| 2024 | $4,038 | $280,200 | $55,300 | $224,900 |
| 2023 | $3,823 | $250,500 | $47,800 | $202,700 |
| 2022 | $4,061 | $230,600 | $43,800 | $186,800 |
| 2021 | $3,866 | $210,900 | $43,300 | $167,600 |
| 2020 | $3,726 | $190,900 | $39,200 | $151,700 |
| 2019 | $3,230 | $167,100 | $39,200 | $127,900 |
| 2018 | $3,019 | $149,000 | $35,200 | $113,800 |
| 2017 | $2,933 | $149,100 | $37,000 | $112,100 |
| 2016 | $2,952 | $149,100 | $37,000 | $112,100 |
| 2015 | $2,926 | $153,100 | $41,000 | $112,100 |
| 2014 | $2,947 | $150,600 | $38,500 | $112,100 |
Source: Public Records
Map
Nearby Homes
- 31 South St
- 144 Main St
- 18 Beech St
- 28 Beech St
- 5 Chestnut Dr
- 64 Maplewood Dr
- 91 Highland St
- 75 Highland St
- 41 West St
- 10 Hillside St
- 18 Crosswinds Dr
- 110 Haynes Rd
- 10 Stearns Ave
- 1 Depot Street Extension Unit 2
- 1 Depot Street Extension Unit 5
- 1 Depot Street Extension Unit 3
- 1 Depot Street Extension Unit 4
- 2 Tamarack Ln
- 22 Lakin St
- 105 West St