
Seller's Agent in 2020
Paul Vasquez
A&B Realty Group
(617) 407-8800
24 Total Sales
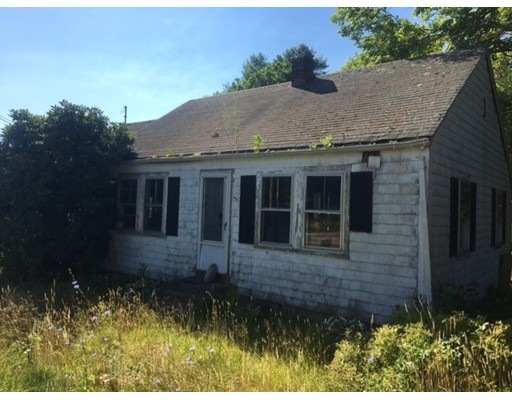
Mattapoisett Cape needs complete rehab. High visibility, high traffic location! This is a rare opportunity! Don't wait!
Last Buyer's Agent
Alex Kamouzis
Boston Moves Real Estate, LLC
| Date | Status | Loan Amount | Loan Type |
|---|---|---|---|
| Closed | $0 | Stand Alone Refi Refinance Of Original Loan | |
| Closed | $339,000 | VA | |
| Closed | $340,000 | VA | |
| Closed | $30,000 | No Value Available |
| Date | Event | Price | Change | Sq Ft Price |
|---|---|---|---|---|
| 01/17/2020 01/17/20 | Sold | $340,000 | +0.3% | $243 / Sq Ft |
| 12/02/2019 12/02/19 | Pending | -- | -- | -- |
| 11/15/2019 11/15/19 | Price Changed | $338,900 | -1.5% | $242 / Sq Ft |
| 10/15/2019 10/15/19 | Price Changed | $343,900 | -3.1% | $246 / Sq Ft |
| 09/30/2019 09/30/19 | For Sale | $354,900 | +4.4% | $254 / Sq Ft |
| 09/26/2019 09/26/19 | Off Market | $340,000 | -- | -- |
| 09/17/2019 09/17/19 | Price Changed | $354,900 | -3.8% | $254 / Sq Ft |
| 08/21/2019 08/21/19 | For Sale | $369,000 | 0.0% | $264 / Sq Ft |
| 07/03/2019 07/03/19 | Pending | -- | -- | -- |
| 05/01/2019 05/01/19 | Price Changed | $369,000 | -5.1% | $264 / Sq Ft |
| 04/07/2019 04/07/19 | Price Changed | $389,000 | -7.2% | $278 / Sq Ft |
| 04/02/2019 04/02/19 | Price Changed | $419,000 | -4.6% | $299 / Sq Ft |
| 03/12/2019 03/12/19 | For Sale | $439,000 | +213.8% | $314 / Sq Ft |
| 10/31/2016 10/31/16 | Sold | $139,900 | 0.0% | $115 / Sq Ft |
| 10/15/2016 10/15/16 | Pending | -- | -- | -- |
| 09/07/2016 09/07/16 | Price Changed | $139,900 | -6.7% | $115 / Sq Ft |
| 08/17/2016 08/17/16 | Price Changed | $149,900 | -6.3% | $124 / Sq Ft |
| 08/09/2016 08/09/16 | For Sale | $159,900 | 0.0% | $132 / Sq Ft |
| 08/02/2016 08/02/16 | Pending | -- | -- | -- |
| 07/19/2016 07/19/16 | For Sale | $159,900 | -- | $132 / Sq Ft |
| Year | Tax Paid | Tax Assessment Tax Assessment Total Assessment is a certain percentage of the fair market value that is determined by local assessors to be the total taxable value of land and additions on the property. | Land | Improvement |
|---|---|---|---|---|
| 2025 | $5,396 | $501,500 | $157,100 | $344,400 |
| 2024 | $5,228 | $497,400 | $157,100 | $340,300 |
| 2023 | $5,326 | $473,400 | $140,300 | $333,100 |
| 2022 | $5,082 | $409,800 | $116,900 | $292,900 |
| 2021 | $4,279 | $330,200 | $93,500 | $236,700 |
| 2020 | $2,903 | $215,200 | $89,000 | $126,200 |
| 2019 | $1,794 | $135,800 | $74,200 | $61,600 |
| 2018 | $1,991 | $152,900 | $86,500 | $66,400 |
| 2017 | $2,132 | $163,100 | $99,800 | $63,300 |
| 2016 | $2,247 | $170,200 | $113,100 | $57,100 |
| 2015 | $2,544 | $195,700 | $106,400 | $89,300 |
| 2014 | $2,444 | $192,100 | $106,400 | $85,700 |
Seller's Agent in 2020
Paul Vasquez
A&B Realty Group
(617) 407-8800
24 Total Sales
Buyer's Agent in 2020
Raymond Turcotte
Coldwell Banker Realty - Franklin
(508) 243-5824
163 Total Sales
Seller's Agent in 2016
Kenneth Mongeon
KAM Realty
(508) 264-9811
149 Total Sales
A
Buyer's Agent in 2016
Alex Kamouzis
Boston Moves Real Estate, LLC
Source: MLS Property Information Network (MLS PIN)
MLS Number: 72040517
APN: MATT-000050-000000-001390
Disclaimer: Certain information contained herein is derived from information provided by parties other than Homes.com. All information provided is deemed reliable, but is not guaranteed to be accurate and should be independently verified.
![]() The property listing data and information, or the Images, set forth herein were provided to MLS Property Information Network, Inc. from third party sources, including sellers, lessors and public records, and were compiled by MLS Property Information Network, Inc. The property listing data and information, and the Images, are for the personal, non-commercial use of consumers having a good faith interest in purchasing or leasing listed properties of the type displayed to them and may not be used for any purpose other than to identify prospective properties which such consumers may have a good faith interest in purchasing or leasing. MLS Property Information Network, Inc. and its subscribers disclaim any and all representations and warranties as to the accuracy of the property listing data and information, or as to the accuracy of any of the Images, set forth herein.
The property listing data and information, or the Images, set forth herein were provided to MLS Property Information Network, Inc. from third party sources, including sellers, lessors and public records, and were compiled by MLS Property Information Network, Inc. The property listing data and information, and the Images, are for the personal, non-commercial use of consumers having a good faith interest in purchasing or leasing listed properties of the type displayed to them and may not be used for any purpose other than to identify prospective properties which such consumers may have a good faith interest in purchasing or leasing. MLS Property Information Network, Inc. and its subscribers disclaim any and all representations and warranties as to the accuracy of the property listing data and information, or as to the accuracy of any of the Images, set forth herein.