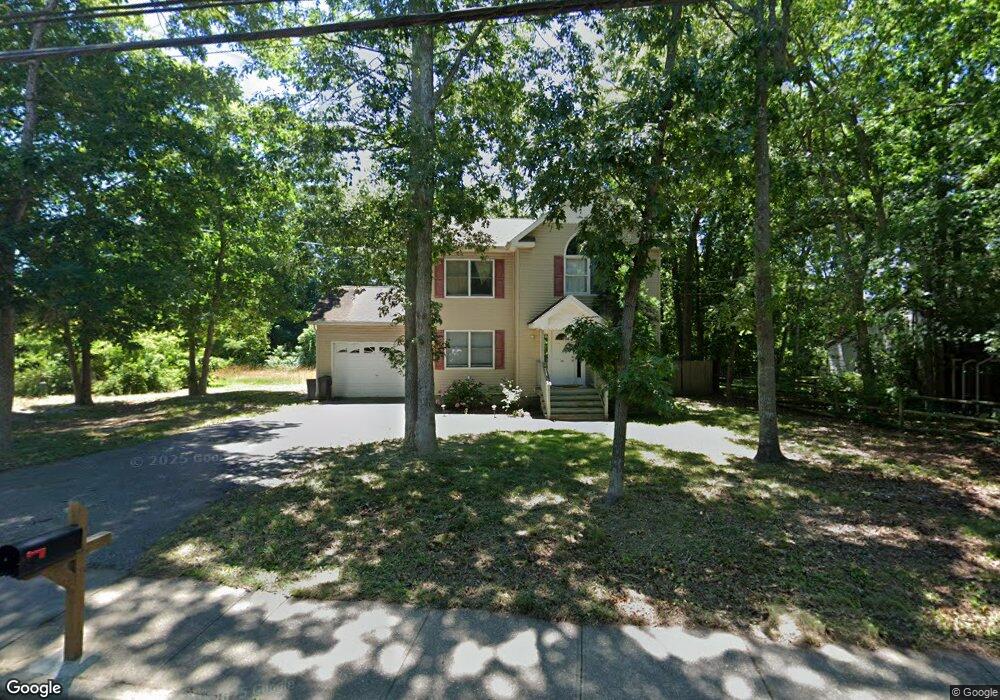
86 Moriches Mid Isl Rd Unit C Shirley, NY 11967
Estimated Value: $598,000 - $633,000
4
Beds
2
Baths
1,848
Sq Ft
$335/Sq Ft
Est. Value
About This Home
This home is located at 86 Moriches Mid Isl Rd Unit C, Shirley, NY 11967 and is currently estimated at $618,282, approximately $334 per square foot. 86 Moriches Mid Isl Rd Unit C is a home located in Suffolk County with nearby schools including Longwood Junior High School, Longwood Middle School, and Longwood Senior High School.
Ownership History
Date
Name
Owned For
Owner Type
Purchase Details
Closed on
Jan 17, 2025
Sold by
Musa Home Inc
Bought by
Lianos Yenny E
Current Estimated Value
Purchase Details
Closed on
Jun 24, 2024
Sold by
Pennymac Ln Svcs Llc and Hartmann
Bought by
Ac & Sons Constr Inc
Purchase Details
Closed on
Jun 1, 2019
Sold by
Triple R Resales Inc
Bought by
Hartmann Joseph and Anselmo Angela R
Home Financials for this Owner
Home Financials are based on the most recent Mortgage that was taken out on this home.
Original Mortgage
$301,832
Interest Rate
4.62%
Mortgage Type
FHA
Purchase Details
Closed on
Mar 10, 2006
Sold by
Vesiliobes Sauuas
Bought by
Triple R Re Sales Inc
Purchase Details
Closed on
Aug 25, 1998
Sold by
County Of Suffolk
Bought by
Vasiliades Savvas I
Create a Home Valuation Report for This Property
The Home Valuation Report is an in-depth analysis detailing your home's value as well as a comparison with similar homes in the area
Home Values in the Area
Average Home Value in this Area
Purchase History
| Date | Buyer | Sale Price | Title Company |
|---|---|---|---|
| Lianos Yenny E | $615,000 | None Available | |
| Lianos Yenny E | $615,000 | None Available | |
| Ac & Sons Constr Inc | $376,531 | None Available | |
| Ac & Sons Constr Inc | $376,531 | None Available | |
| Hartmann Joseph | $307,500 | -- | |
| Hartmann Joseph | $307,500 | -- | |
| Triple R Re Sales Inc | $155,000 | Harvey Goldstein | |
| Vasiliades Savvas I | $17,000 | -- | |
| Vasiliades Savvas I | $17,000 | -- |
Source: Public Records
Mortgage History
| Date | Status | Borrower | Loan Amount |
|---|---|---|---|
| Previous Owner | Hartmann Joseph | $301,832 |
Source: Public Records
Tax History Compared to Growth
Tax History
| Year | Tax Paid | Tax Assessment Tax Assessment Total Assessment is a certain percentage of the fair market value that is determined by local assessors to be the total taxable value of land and additions on the property. | Land | Improvement |
|---|---|---|---|---|
| 2024 | $11,072 | $2,550 | $240 | $2,310 |
| 2023 | $11,072 | $2,550 | $240 | $2,310 |
| 2022 | $9,807 | $2,550 | $240 | $2,310 |
| 2021 | $9,807 | $2,550 | $240 | $2,310 |
| 2020 | $10,624 | $2,550 | $240 | $2,310 |
| 2019 | $10,624 | $0 | $0 | $0 |
| 2018 | -- | $2,550 | $240 | $2,310 |
| 2017 | $9,998 | $2,550 | $240 | $2,310 |
| 2016 | $9,882 | $2,550 | $240 | $2,310 |
| 2015 | -- | $2,550 | $240 | $2,310 |
| 2014 | -- | $2,550 | $240 | $2,310 |
Source: Public Records
Map
Nearby Homes
- 411 Glen Dr
- 459 Wellwood Dr
- 8 & 11 William Floyd Pkwy
- 461 Avondale Dr
- Lot Avondale Dr
- 380 Wellwood Dr
- 68 Crestwood Dr
- 101 Crestwood Dr
- 509 Lockwood Dr
- 334 Carnation Dr
- 1330 William Floyd Pkwy
- 8 Stratler Dr
- 425 Puritan Dr
- 65 Colin Dr
- 149 Crestwood Dr
- 283 W End Ave
- 187 Carleton Dr E
- 336 Auborn Ave
- 567 Puritan Dr
- 500 Boxwood Dr
- 80 Moriches Mid Isl Rd
- 80 Moriches Middle Island Rd
- 76 Moriches Middle Island Rd
- 76 Moriches Middle Island Rd
- 443 Carnation Dr
- 85 Moriches Middle Island Rd
- 442 Carnation Dr
- 420 Carnation Dr
- 420 Free State Dr
- 81 Moriches Middle Island Rd
- 72 Moriches Middle Island Rd
- 420 Freestate Dr
- Lot #6 N/C Carnation Dr
- Lot #5 N/C Carnation Dr
- N/C Carnation Dr
- Lot #2 N/C Carnation Dr
- Lot #1 N/C Carnation Dr
- N/C Carnation Dr
- Lot 1 Carnation Dr
- Lot 3 Carnation Dr