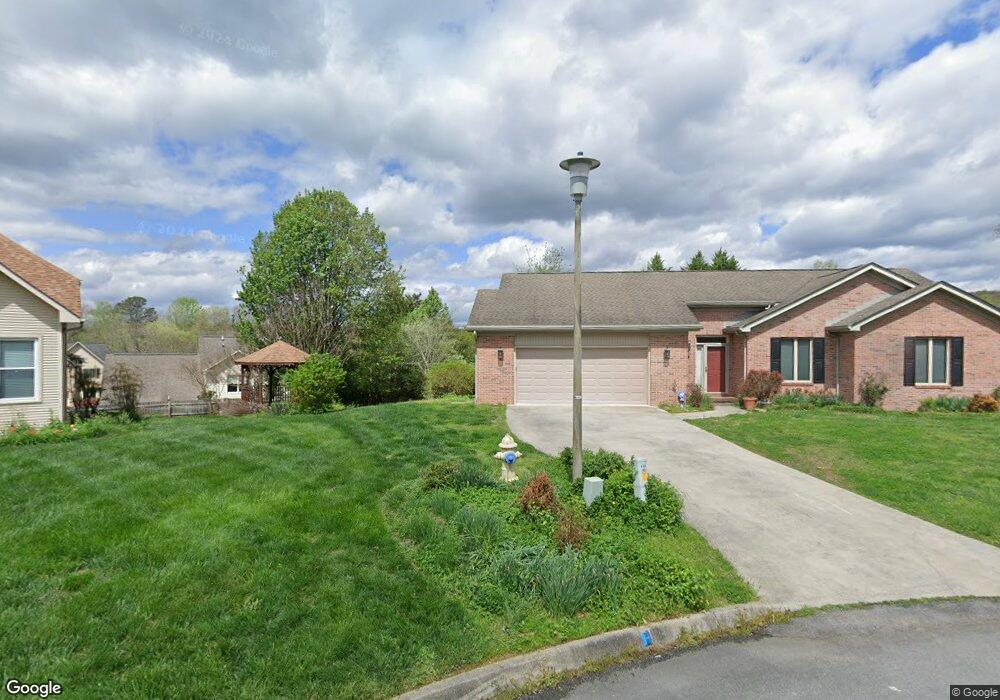
86 N Claymore Ln Oak Ridge, TN 37830
Estimated Value: $427,269 - $557,000
--
Bed
2
Baths
1,707
Sq Ft
$280/Sq Ft
Est. Value
About This Home
This home is located at 86 N Claymore Ln, Oak Ridge, TN 37830 and is currently estimated at $477,317, approximately $279 per square foot. 86 N Claymore Ln is a home located in Anderson County with nearby schools including Woodland Elementary School, Jefferson Middle School, and Oak Ridge High School.
Ownership History
Date
Name
Owned For
Owner Type
Purchase Details
Closed on
Jul 17, 2017
Sold by
Snodreass Leslie and The Mary H Carente Trust
Bought by
Doughty Carla K
Current Estimated Value
Home Financials for this Owner
Home Financials are based on the most recent Mortgage that was taken out on this home.
Original Mortgage
$207,000
Outstanding Balance
$141,212
Interest Rate
3.89%
Mortgage Type
New Conventional
Estimated Equity
$336,105
Purchase Details
Closed on
Sep 8, 2011
Sold by
Carpenter Mary H
Bought by
Carpenter Mary H and Carpenter Bill
Purchase Details
Closed on
Sep 13, 2004
Sold by
Brady Michael P
Bought by
Carpenter Mary
Purchase Details
Closed on
Sep 30, 1998
Sold by
Winchester Louise
Bought by
Brady Michael
Home Financials for this Owner
Home Financials are based on the most recent Mortgage that was taken out on this home.
Original Mortgage
$137,250
Interest Rate
6.96%
Purchase Details
Closed on
Sep 30, 1993
Bought by
Winchester Louise
Create a Home Valuation Report for This Property
The Home Valuation Report is an in-depth analysis detailing your home's value as well as a comparison with similar homes in the area
Home Values in the Area
Average Home Value in this Area
Purchase History
| Date | Buyer | Sale Price | Title Company |
|---|---|---|---|
| Doughty Carla K | $230,000 | Amerial Title Inc | |
| Carpenter Mary H | -- | -- | |
| Carpenter Mary | $175,000 | -- | |
| Brady Michael | $144,500 | -- | |
| Winchester Louise | $137,000 | -- |
Source: Public Records
Mortgage History
| Date | Status | Borrower | Loan Amount |
|---|---|---|---|
| Open | Doughty Carla K | $207,000 | |
| Previous Owner | Winchester Louise | $137,250 |
Source: Public Records
Tax History Compared to Growth
Tax History
| Year | Tax Paid | Tax Assessment Tax Assessment Total Assessment is a certain percentage of the fair market value that is determined by local assessors to be the total taxable value of land and additions on the property. | Land | Improvement |
|---|---|---|---|---|
| 2024 | $1,490 | $60,650 | $9,475 | $51,175 |
| 2023 | $1,490 | $60,650 | $0 | $0 |
| 2022 | $2,893 | $60,650 | $9,475 | $51,175 |
| 2021 | $2,893 | $60,650 | $9,475 | $51,175 |
| 2020 | $2,612 | $60,650 | $9,475 | $51,175 |
| 2019 | $2,673 | $50,875 | $7,925 | $42,950 |
| 2018 | $2,612 | $50,875 | $7,925 | $42,950 |
| 2017 | $2,602 | $50,875 | $7,925 | $42,950 |
| 2016 | $2,602 | $50,875 | $7,925 | $42,950 |
| 2015 | -- | $50,875 | $7,925 | $42,950 |
| 2014 | -- | $50,875 | $7,925 | $42,950 |
| 2013 | -- | $56,350 | $0 | $0 |
Source: Public Records
Map
Nearby Homes
- 140 Brandeis Ln
- 16 Belmont Ct
- 103 Baltimore Dr
- 114 Canterbury Rd
- 105 Deerfield Ln
- 111 Baypath Dr
- 116 Baltimore Dr
- 101 Concord Rd
- 170 Cumberland View Dr
- 112 Chestnut Hill Rd
- 126 Clifton Cir
- 109 Balsam Rd
- 131 Clifton Cir
- 110 Balsam Rd
- 162 High Point Ln
- 98 Hampshire Cir
- 160 High Point Ln
- 119 Hanover Place
- 42 Palisades Pkwy
- 187 Tacoma Rd
- 117 Capital Cir
- 88 N Claymore Ln
- 85 N Claymore Ln
- 119 Capital Cir
- 87 N Claymore Ln
- 121 Capital Cir
- 90 N Claymore Ln
- 113 Capital Cir
- 101 Chester Ln
- 92 N Claymore Ln
- 123 Capital Cir
- 118 Capital Cir
- 111 Capital Cir
- 89 N Claymore Ln
- 124 Capital Cir
- 122 Capital Cir
- 116 Capital Cir
- 126 Capital Cir
- 94 N Claymore Ln
- 109 Capital Cir