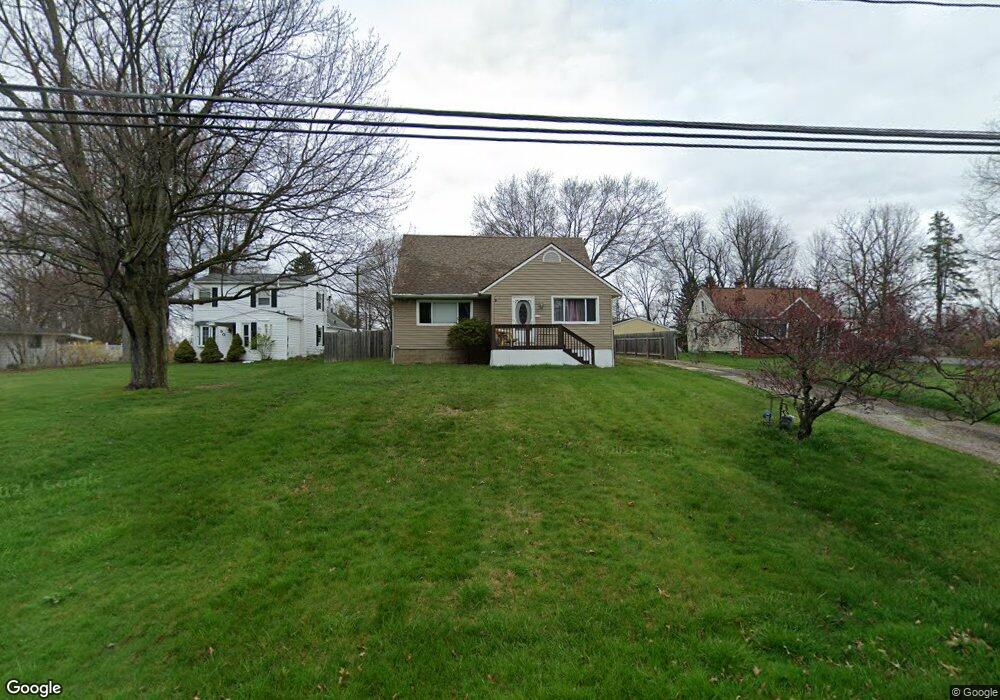
86 van Evera Rd Tallmadge, OH 44278
Estimated Value: $227,000 - $246,000
4
Beds
3
Baths
1,452
Sq Ft
$162/Sq Ft
Est. Value
About This Home
This home is located at 86 van Evera Rd, Tallmadge, OH 44278 and is currently estimated at $234,773, approximately $161 per square foot. 86 van Evera Rd is a home located in Summit County with nearby schools including Tallmadge Middle School, Tallmadge High School, and Cornerstone Community School.
Ownership History
Date
Name
Owned For
Owner Type
Purchase Details
Closed on
Jan 31, 2022
Sold by
Moore and Cynthia
Bought by
Kirk Ian and Chicoine Karren
Current Estimated Value
Home Financials for this Owner
Home Financials are based on the most recent Mortgage that was taken out on this home.
Original Mortgage
$171,830
Outstanding Balance
$159,557
Interest Rate
3.55%
Mortgage Type
FHA
Estimated Equity
$75,216
Purchase Details
Closed on
Sep 17, 2010
Sold by
Us Bank National Association Nd
Bought by
Moore Lester and Moore Cynthia
Purchase Details
Closed on
Apr 8, 2010
Sold by
Spencer Robert D and Spencer Samantha K
Bought by
Us Bank National Association Nd
Purchase Details
Closed on
Apr 15, 2002
Sold by
Spencer Bonnie R
Bought by
Spencer Robert D and Spencer Samantha K
Home Financials for this Owner
Home Financials are based on the most recent Mortgage that was taken out on this home.
Original Mortgage
$49,000
Interest Rate
7.13%
Mortgage Type
Stand Alone Second
Create a Home Valuation Report for This Property
The Home Valuation Report is an in-depth analysis detailing your home's value as well as a comparison with similar homes in the area
Home Values in the Area
Average Home Value in this Area
Purchase History
| Date | Buyer | Sale Price | Title Company |
|---|---|---|---|
| Kirk Ian | $175,000 | Windon Jeffrey D | |
| Moore Lester | $48,000 | Progressive Land Title | |
| Us Bank National Association Nd | -- | None Available | |
| Spencer Robert D | -- | -- |
Source: Public Records
Mortgage History
| Date | Status | Borrower | Loan Amount |
|---|---|---|---|
| Open | Kirk Ian | $171,830 | |
| Previous Owner | Spencer Robert D | $49,000 |
Source: Public Records
Tax History Compared to Growth
Tax History
| Year | Tax Paid | Tax Assessment Tax Assessment Total Assessment is a certain percentage of the fair market value that is determined by local assessors to be the total taxable value of land and additions on the property. | Land | Improvement |
|---|---|---|---|---|
| 2025 | $2,784 | $55,808 | $11,116 | $44,692 |
| 2024 | $2,784 | $55,808 | $11,116 | $44,692 |
| 2023 | $2,784 | $55,808 | $11,116 | $44,692 |
| 2022 | $2,629 | $43,082 | $8,484 | $34,598 |
| 2021 | $2,641 | $43,082 | $8,484 | $34,598 |
| 2020 | $2,620 | $43,080 | $8,480 | $34,600 |
| 2019 | $2,612 | $38,390 | $9,650 | $28,740 |
| 2018 | $2,301 | $38,390 | $9,650 | $28,740 |
| 2017 | $2,175 | $38,390 | $9,650 | $28,740 |
| 2016 | $2,346 | $35,980 | $9,650 | $26,330 |
| 2015 | $2,175 | $35,980 | $9,650 | $26,330 |
| 2014 | $2,161 | $35,980 | $9,650 | $26,330 |
| 2013 | $2,454 | $41,350 | $9,650 | $31,700 |
Source: Public Records
Map
Nearby Homes
- 464 Carruthers Rd
- 261 van Evera Rd
- 572 Eastglen Cir
- 500 Dottie Ct Unit 109
- 462 Pickwick Ln
- 75 Glenwood Cir
- 130 Strecker Dr
- 159 Waterford Way Unit 44
- 2333 Eastwood Ave
- 93 Olalla Ave
- 926 Burbank Ave
- 1623 Romona Rd
- 313 Southeast Ave
- 1641 Slusser Rd
- 353 Southeast Ave
- 2354 Savoy Ave
- 689 Alaho St
- 2253 Tyro Ave
- 2405 Briner Ave
- 469 Lodi St
- 90 van Evera Rd
- 78 van Evera Rd
- 98 van Evera Rd
- 72 van Evera Rd
- 106 van Evera Rd
- 77 van Evera Rd
- 89 van Evera Rd
- 62 van Evera Rd
- 71 van Evera Rd
- 112 van Evera Rd
- 95 van Evera Rd
- 103 van Evera Rd
- 360 Jones Rd
- 46 van Evera Rd
- 57 van Evera Rd
- 348 Jones Rd
- 43 van Evera Rd
- 132 van Evera Rd
- 127 van Evera Rd
- 38 van Evera Rd