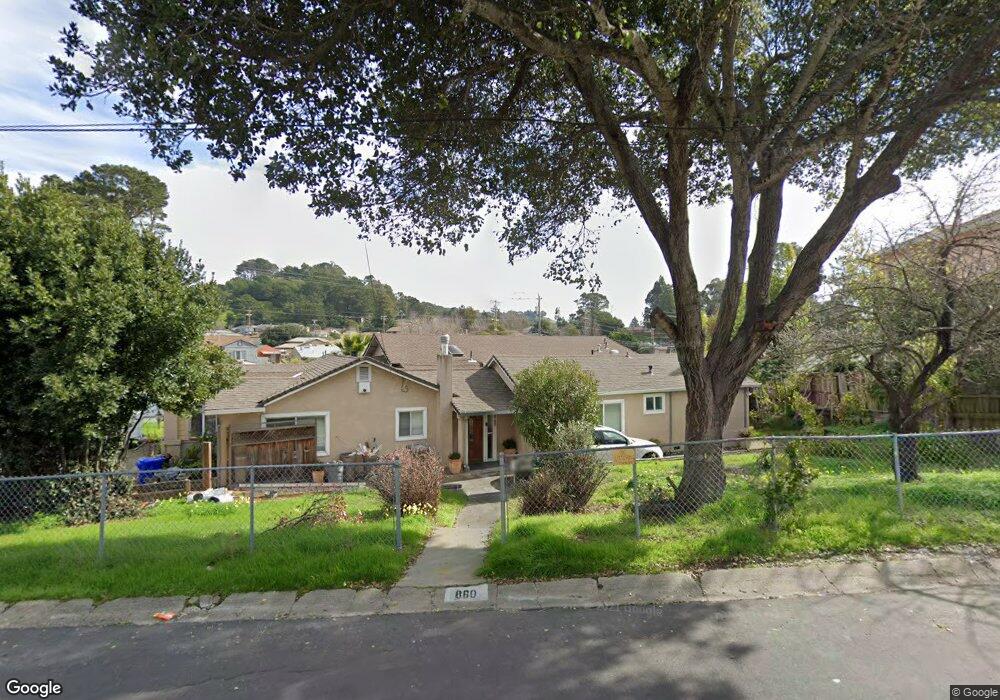
860 Fulton Way El Sobrante, CA 94803
El Sobrante Manor NeighborhoodEstimated Value: $741,000 - $884,108
4
Beds
3
Baths
2,522
Sq Ft
$315/Sq Ft
Est. Value
About This Home
This home is located at 860 Fulton Way, El Sobrante, CA 94803 and is currently estimated at $794,527, approximately $315 per square foot. 860 Fulton Way is a home located in Contra Costa County with nearby schools including Murphy Elementary School, Betty Reid Soskin Middle School, and De Anza Senior High School.
Ownership History
Date
Name
Owned For
Owner Type
Purchase Details
Closed on
Sep 17, 2002
Sold by
Soungpanya Sean and Sayavong Connie Bouakham
Bought by
Soungpanya Sean and Sayavong Connie Bouakham
Current Estimated Value
Purchase Details
Closed on
Jun 23, 1998
Sold by
Mary F Griffin Living Trust and Elizabeth Mary Elizabeth
Bought by
Soungpanya Sean and Soungpanya Bouakham
Home Financials for this Owner
Home Financials are based on the most recent Mortgage that was taken out on this home.
Original Mortgage
$114,950
Outstanding Balance
$22,956
Interest Rate
7.03%
Mortgage Type
Purchase Money Mortgage
Estimated Equity
$771,571
Purchase Details
Closed on
Nov 17, 1997
Sold by
The Mary F Griffin Living Trust
Bought by
Lumel Mary Elizabeth
Create a Home Valuation Report for This Property
The Home Valuation Report is an in-depth analysis detailing your home's value as well as a comparison with similar homes in the area
Home Values in the Area
Average Home Value in this Area
Purchase History
| Date | Buyer | Sale Price | Title Company |
|---|---|---|---|
| Soungpanya Sean | -- | First American Title | |
| Soungpanya Sean | $155,000 | North American Title Co | |
| Lumel Mary Elizabeth | -- | North American Title Co | |
| Lumel Mary Elizabeth | -- | -- |
Source: Public Records
Mortgage History
| Date | Status | Borrower | Loan Amount |
|---|---|---|---|
| Open | Soungpanya Sean | $114,950 |
Source: Public Records
Tax History Compared to Growth
Tax History
| Year | Tax Paid | Tax Assessment Tax Assessment Total Assessment is a certain percentage of the fair market value that is determined by local assessors to be the total taxable value of land and additions on the property. | Land | Improvement |
|---|---|---|---|---|
| 2025 | $5,841 | $370,775 | $97,183 | $273,592 |
| 2024 | $5,711 | $363,506 | $95,278 | $268,228 |
| 2023 | $5,711 | $356,379 | $93,410 | $262,969 |
| 2022 | $5,625 | $349,392 | $91,579 | $257,813 |
| 2021 | $5,591 | $342,542 | $89,784 | $252,758 |
| 2019 | $5,287 | $332,384 | $87,122 | $245,262 |
| 2018 | $5,080 | $325,867 | $85,414 | $240,453 |
| 2017 | $4,950 | $319,479 | $83,740 | $235,739 |
| 2016 | $4,876 | $313,216 | $82,099 | $231,117 |
| 2015 | $4,847 | $308,512 | $80,866 | $227,646 |
| 2014 | $4,801 | $302,469 | $79,282 | $223,187 |
Source: Public Records
Map
Nearby Homes
- 1703 Dalessi Dr
- 923 Kelvin Rd
- 535 Rincon Rd
- 5026 Hilltop Dr
- 663 Renfrew Rd
- 1923 Thompson Ln
- 1051 Saint Andrews Dr
- 209 N Rancho Place
- 4778 Hilltop Dr Unit 1
- 107 Alice Ln Unit 13
- 371 Joan Vista St
- 636 Pebble Dr
- 12 Park Ct
- 3115 Deseret Dr
- 4404 Meadowbrook Dr
- 2180 Shea Dr
- 742 La Paloma Rd
- 61 Homer Ct
- 4623 Appian Way
- 30 Greenview Ln
- 817 Appian Way
- 840 Fulton Way
- 857 Fulton Way
- 845 Fulton Way
- 860 Appian Way
- 867 Fulton Way
- 838 Appian Way
- 844 Appian Way
- 848 Appian Way
- 870 Appian Way
- 805 Appian Way
- 2001 Rancho Rd
- 831 Fulton Way
- 830 Fulton Way
- 871 Fulton Way
- 903 Appian Way
- 2011 Rancho Rd
- 723 Appian Way
- 844 Idlewood Cir
- 818 Fulton Way