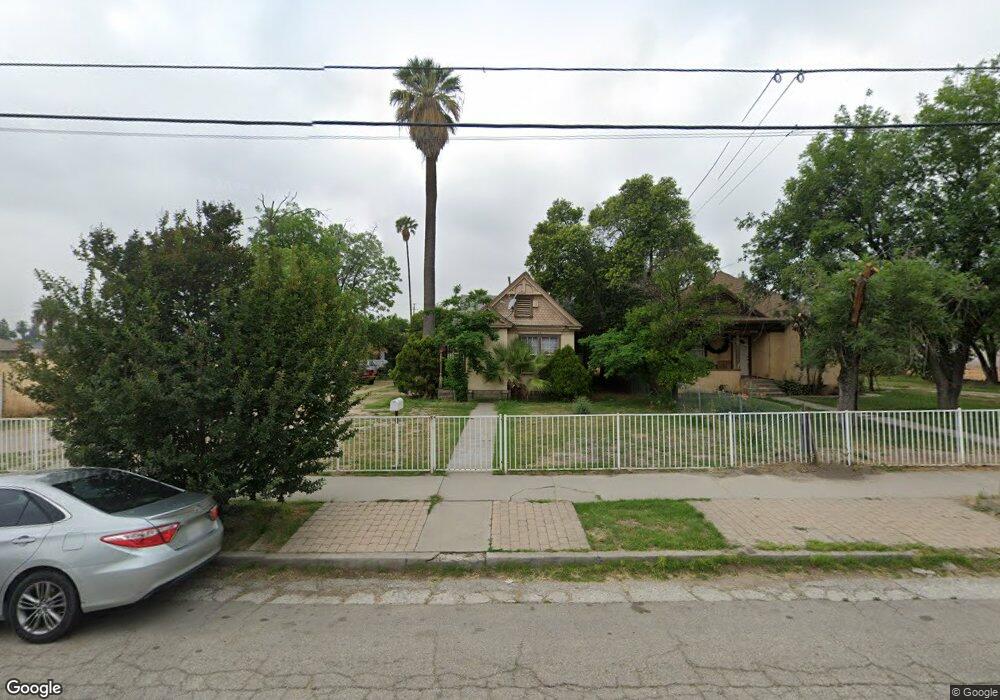
860 N F St San Bernardino, CA 92410
Civic Center NeighborhoodEstimated Value: $432,000 - $512,299
3
Beds
2
Baths
1,776
Sq Ft
$275/Sq Ft
Est. Value
About This Home
This home is located at 860 N F St, San Bernardino, CA 92410 and is currently estimated at $487,825, approximately $274 per square foot. 860 N F St is a home located in San Bernardino County with nearby schools including Juanita Blakely Jones Elementary School, Arrowview Middle School, and Indian Springs High.
Ownership History
Date
Name
Owned For
Owner Type
Purchase Details
Closed on
Jun 25, 2008
Sold by
Washington Mutual Bank Fa
Bought by
Abdullah Ghassan and Brewart Nelson
Current Estimated Value
Purchase Details
Closed on
Nov 19, 2007
Sold by
Najera Laura
Bought by
Washington Mutual Bank
Purchase Details
Closed on
Jan 29, 2007
Sold by
Yanez Salvador
Bought by
Najera Laura
Home Financials for this Owner
Home Financials are based on the most recent Mortgage that was taken out on this home.
Original Mortgage
$84,000
Interest Rate
6.17%
Mortgage Type
Stand Alone Second
Purchase Details
Closed on
Jan 10, 2006
Sold by
Palma Edwin and Palma Gloria
Bought by
Palma Edwin
Home Financials for this Owner
Home Financials are based on the most recent Mortgage that was taken out on this home.
Original Mortgage
$60,000
Interest Rate
6.32%
Mortgage Type
Stand Alone Second
Purchase Details
Closed on
Jan 9, 2006
Sold by
Yanez Maria
Bought by
Yanez Salvador
Home Financials for this Owner
Home Financials are based on the most recent Mortgage that was taken out on this home.
Original Mortgage
$60,000
Interest Rate
6.32%
Mortgage Type
Stand Alone Second
Purchase Details
Closed on
Nov 4, 2005
Sold by
Palma Edwin
Bought by
Yanez Salvador
Home Financials for this Owner
Home Financials are based on the most recent Mortgage that was taken out on this home.
Original Mortgage
$240,000
Interest Rate
8.12%
Mortgage Type
Fannie Mae Freddie Mac
Purchase Details
Closed on
May 22, 2001
Sold by
Miles Janie Raitt and Holcombe Ada Elizabeth
Bought by
Palma Edwin
Home Financials for this Owner
Home Financials are based on the most recent Mortgage that was taken out on this home.
Original Mortgage
$64,000
Interest Rate
7.15%
Mortgage Type
Seller Take Back
Create a Home Valuation Report for This Property
The Home Valuation Report is an in-depth analysis detailing your home's value as well as a comparison with similar homes in the area
Home Values in the Area
Average Home Value in this Area
Purchase History
| Date | Buyer | Sale Price | Title Company |
|---|---|---|---|
| Abdullah Ghassan | $153,000 | Chicago Title Company | |
| Washington Mutual Bank | $297,000 | None Available | |
| Najera Laura | $420,000 | Fatcola | |
| Najera Laura | -- | First American Title Co La | |
| Palma Edwin | -- | Stewart Title Company | |
| Yanez Salvador | -- | Stewart Title Company | |
| Yanez Salvador | $300,000 | Stewart Title Company | |
| Palma Edwin | $65,000 | United Title Company |
Source: Public Records
Mortgage History
| Date | Status | Borrower | Loan Amount |
|---|---|---|---|
| Previous Owner | Najera Laura | $84,000 | |
| Previous Owner | Najera Laura | $336,000 | |
| Previous Owner | Palma Edwin | $60,000 | |
| Previous Owner | Yanez Salvador | $60,000 | |
| Previous Owner | Yanez Salvador | $240,000 | |
| Previous Owner | Palma Edwin | $64,000 |
Source: Public Records
Tax History Compared to Growth
Tax History
| Year | Tax Paid | Tax Assessment Tax Assessment Total Assessment is a certain percentage of the fair market value that is determined by local assessors to be the total taxable value of land and additions on the property. | Land | Improvement |
|---|---|---|---|---|
| 2025 | $4,568 | $360,574 | $108,172 | $252,402 |
| 2024 | $4,568 | $353,504 | $106,051 | $247,453 |
| 2023 | $4,336 | $337,000 | $101,000 | $236,000 |
| 2022 | $3,418 | $257,000 | $77,000 | $180,000 |
| 2021 | $3,398 | $250,000 | $100,000 | $150,000 |
| 2020 | $3,450 | $243,100 | $73,100 | $170,000 |
| 2019 | $3,221 | $236,000 | $71,000 | $165,000 |
| 2018 | $4,585 | $196,200 | $58,600 | $137,600 |
| 2017 | $2,659 | $189,500 | $56,600 | $132,900 |
| 2016 | $2,416 | $177,100 | $52,900 | $124,200 |
| 2015 | $2,968 | $164,000 | $49,000 | $115,000 |
| 2014 | $1,512 | $115,000 | $34,000 | $81,000 |
Source: Public Records
Map
Nearby Homes