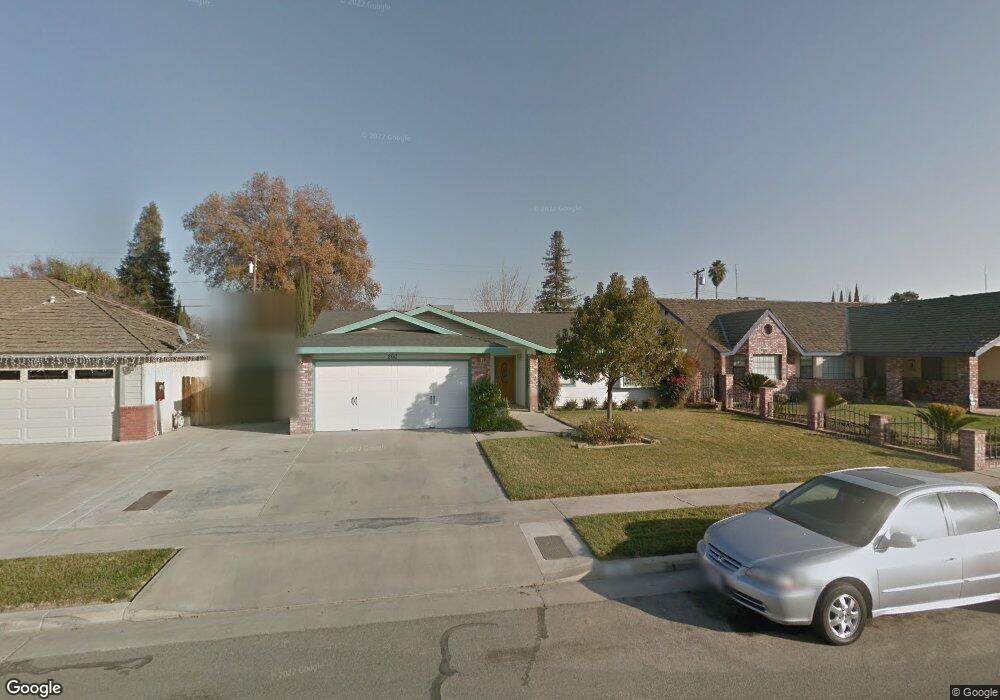
860 S Mark St Tulare, CA 93274
Tulare Southeast NeighborhoodEstimated Value: $320,458 - $353,000
3
Beds
2
Baths
1,380
Sq Ft
$244/Sq Ft
Est. Value
About This Home
This home is located at 860 S Mark St, Tulare, CA 93274 and is currently estimated at $336,865, approximately $244 per square foot. 860 S Mark St is a home located in Tulare County with nearby schools including Frank Kohn Elementary School, Live Oak Middle School, and Tulare Union High School.
Ownership History
Date
Name
Owned For
Owner Type
Purchase Details
Closed on
Jun 27, 2001
Sold by
Cordeniz Brian M
Bought by
Lowrey Gary L
Current Estimated Value
Home Financials for this Owner
Home Financials are based on the most recent Mortgage that was taken out on this home.
Original Mortgage
$96,305
Outstanding Balance
$37,140
Interest Rate
7.15%
Mortgage Type
Purchase Money Mortgage
Estimated Equity
$299,725
Purchase Details
Closed on
Feb 24, 1994
Sold by
Mendonca Bros
Bought by
Cordeniz Brian M and Cordeniz Teanne C
Home Financials for this Owner
Home Financials are based on the most recent Mortgage that was taken out on this home.
Original Mortgage
$102,005
Interest Rate
7.21%
Mortgage Type
FHA
Create a Home Valuation Report for This Property
The Home Valuation Report is an in-depth analysis detailing your home's value as well as a comparison with similar homes in the area
Home Values in the Area
Average Home Value in this Area
Purchase History
| Date | Buyer | Sale Price | Title Company |
|---|---|---|---|
| Lowrey Gary L | $110,000 | Chicago Title Co | |
| Cordeniz Brian M | $102,000 | Fidelity National Title |
Source: Public Records
Mortgage History
| Date | Status | Borrower | Loan Amount |
|---|---|---|---|
| Open | Lowrey Gary L | $96,305 | |
| Previous Owner | Cordeniz Brian M | $102,005 |
Source: Public Records
Tax History Compared to Growth
Tax History
| Year | Tax Paid | Tax Assessment Tax Assessment Total Assessment is a certain percentage of the fair market value that is determined by local assessors to be the total taxable value of land and additions on the property. | Land | Improvement |
|---|---|---|---|---|
| 2025 | $1,769 | $162,510 | $44,321 | $118,189 |
| 2024 | $1,769 | $159,324 | $43,452 | $115,872 |
| 2023 | $1,724 | $156,200 | $42,600 | $113,600 |
| 2022 | $1,673 | $153,138 | $41,765 | $111,373 |
| 2021 | $1,652 | $150,135 | $40,946 | $109,189 |
| 2020 | $1,680 | $148,595 | $40,526 | $108,069 |
| 2019 | $1,722 | $145,681 | $39,731 | $105,950 |
| 2018 | $1,694 | $142,825 | $38,952 | $103,873 |
| 2017 | $1,679 | $140,024 | $38,188 | $101,836 |
| 2016 | $1,605 | $137,278 | $37,439 | $99,839 |
| 2015 | $1,486 | $135,216 | $36,877 | $98,339 |
| 2014 | $1,486 | $127,000 | $32,000 | $95,000 |
Source: Public Records
Map
Nearby Homes
- 931 S Amber St
- 860 S Kazarian St
- 2005 Mount Stewart Ave
- 716 S Kazarian St
- 1533 Etna Dr
- 1572 Jasmine Ct
- 900 S Ann St
- 2570 Trapper Springs Ave
- 1730 E Evergreen Ave
- 980 S Spruce St
- 2690 Kelty Meadow Ave
- 2727 Eshom Creek Ct
- 1625 S Lydia Dr
- 2671 Lakeridge Ave
- 1316 S Spruce St
- 434 Fallbrook Ct
- 501 S Magnolia St
- 1803 Durango Ct
- 2796 Azalea Ave
- 928 Hidden Ridge