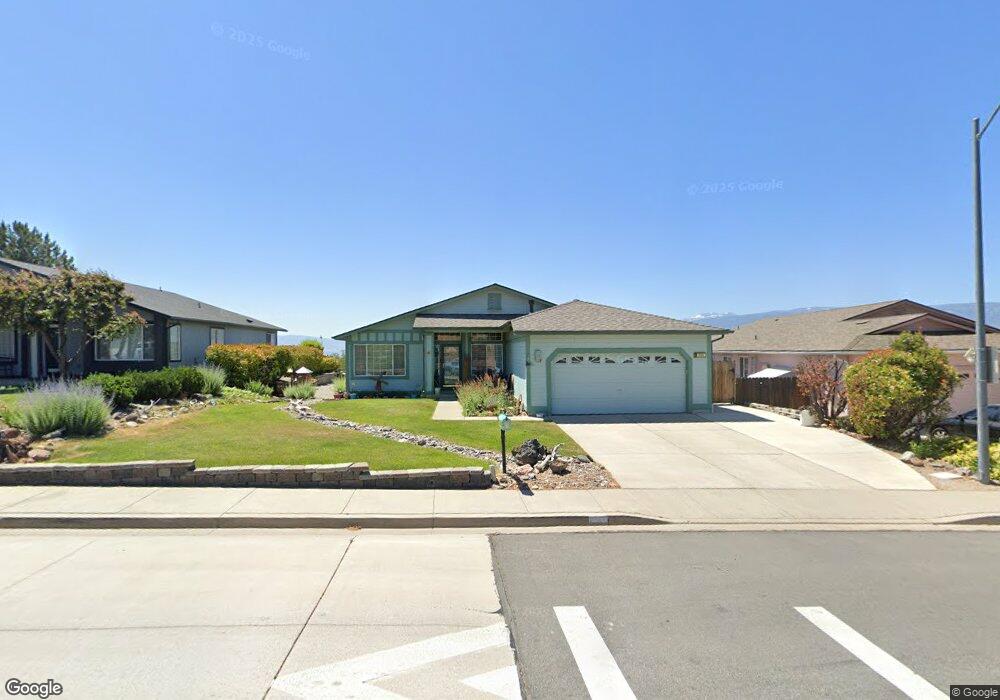
860 S University Park Loop Reno, NV 89512
West University NeighborhoodEstimated Value: $606,719 - $895,000
3
Beds
2
Baths
2,106
Sq Ft
$335/Sq Ft
Est. Value
About This Home
This home is located at 860 S University Park Loop, Reno, NV 89512 and is currently estimated at $705,180, approximately $334 per square foot. 860 S University Park Loop is a home located in Washoe County with nearby schools including Peavine Elementary School, Archie Clayton Pre-AP Academy, and Coral Academy Charter School Elementary.
Ownership History
Date
Name
Owned For
Owner Type
Purchase Details
Closed on
Dec 5, 2022
Sold by
Jennings Vicki Patricia
Bought by
Jennings Family Trust
Current Estimated Value
Purchase Details
Closed on
Nov 11, 2022
Sold by
Jennings Vicki Patricia
Bought by
Jennings Family Trust
Purchase Details
Closed on
Jan 8, 2003
Sold by
Jennings Vicki P
Bought by
Jennings James E and Jennings Vicki P
Home Financials for this Owner
Home Financials are based on the most recent Mortgage that was taken out on this home.
Original Mortgage
$121,000
Interest Rate
6.06%
Purchase Details
Closed on
Oct 20, 1995
Sold by
Jennings James E and Jennings Vicki P
Bought by
Jennings Vicki P
Home Financials for this Owner
Home Financials are based on the most recent Mortgage that was taken out on this home.
Original Mortgage
$65,000
Interest Rate
7.59%
Create a Home Valuation Report for This Property
The Home Valuation Report is an in-depth analysis detailing your home's value as well as a comparison with similar homes in the area
Home Values in the Area
Average Home Value in this Area
Purchase History
| Date | Buyer | Sale Price | Title Company |
|---|---|---|---|
| Jennings Family Trust | -- | -- | |
| Jennings Family Trust | -- | -- | |
| Jennings James E | -- | First American Title | |
| Jennings Vicki P | -- | Western Title Company Inc |
Source: Public Records
Mortgage History
| Date | Status | Borrower | Loan Amount |
|---|---|---|---|
| Previous Owner | Jennings James E | $121,000 | |
| Previous Owner | Jennings Vicki P | $65,000 |
Source: Public Records
Tax History Compared to Growth
Tax History
| Year | Tax Paid | Tax Assessment Tax Assessment Total Assessment is a certain percentage of the fair market value that is determined by local assessors to be the total taxable value of land and additions on the property. | Land | Improvement |
|---|---|---|---|---|
| 2026 | $2,342 | $118,097 | $51,238 | $66,859 |
| 2025 | $3,038 | $119,805 | $51,238 | $68,567 |
| 2024 | $3,038 | $119,864 | $50,400 | $69,464 |
| 2023 | $2,950 | $116,477 | $50,313 | $66,164 |
| 2022 | $2,924 | $102,460 | $46,991 | $55,469 |
| 2021 | $2,840 | $102,782 | $47,880 | $54,902 |
| 2020 | $2,755 | $107,134 | $51,870 | $55,264 |
| 2019 | $2,675 | $103,301 | $49,875 | $53,426 |
| 2018 | $2,597 | $81,064 | $28,438 | $52,626 |
| 2017 | $2,522 | $77,704 | $24,806 | $52,898 |
| 2016 | $2,458 | $81,496 | $27,440 | $54,056 |
| 2015 | $2,454 | $80,454 | $26,163 | $54,291 |
| 2014 | $2,383 | $74,522 | $22,104 | $52,418 |
| 2013 | -- | $63,041 | $19,079 | $43,962 |
Source: Public Records
Map
Nearby Homes
- 3510 Comstock Dr
- 1080 S University Park Loop
- 3621 Pimlico St
- 1120 University Park Ct
- 3566 Penn National Dr
- 1176 Arrastra Rd Unit Lot 16
- 1172 Arrastra Rd
- 1160 Arrastra Rd
- 3656 Ruidoso St
- 3715 Coastal St
- 970 Demos Ct
- 2528 Comstock Dr
- 18 Colombard Way
- 26 S Chardonnay St
- 2135 Barberry Way
- 200 Talus Way Unit 123
- 200 Talus Way Unit 232
- 200 Talus Way Unit 522
- 27 Chianti Way
- 2140 Barberry Way
- 870 S University Park Loop
- 850 S University Park Loop
- 880 S University Park Loop
- 840 S University Park Loop
- 861 University Ridge Dr Unit 1
- 890 S University Park Loop Unit 3
- 921 University Place
- 830 S University Park Loop
- 869 S University Park Loop
- 911 University Place
- 851 University Ridge Dr
- 879 S University Park Loop
- 871 University Ridge Dr
- 900 S University Park Loop
- 820 S University Park Loop Unit 3
- 931 University Place Unit 1
- 889 S University Park Loop Unit 3
- 841 University Ridge Dr Unit 1
- 901 University Ridge Dr
- 810 S University Park Loop