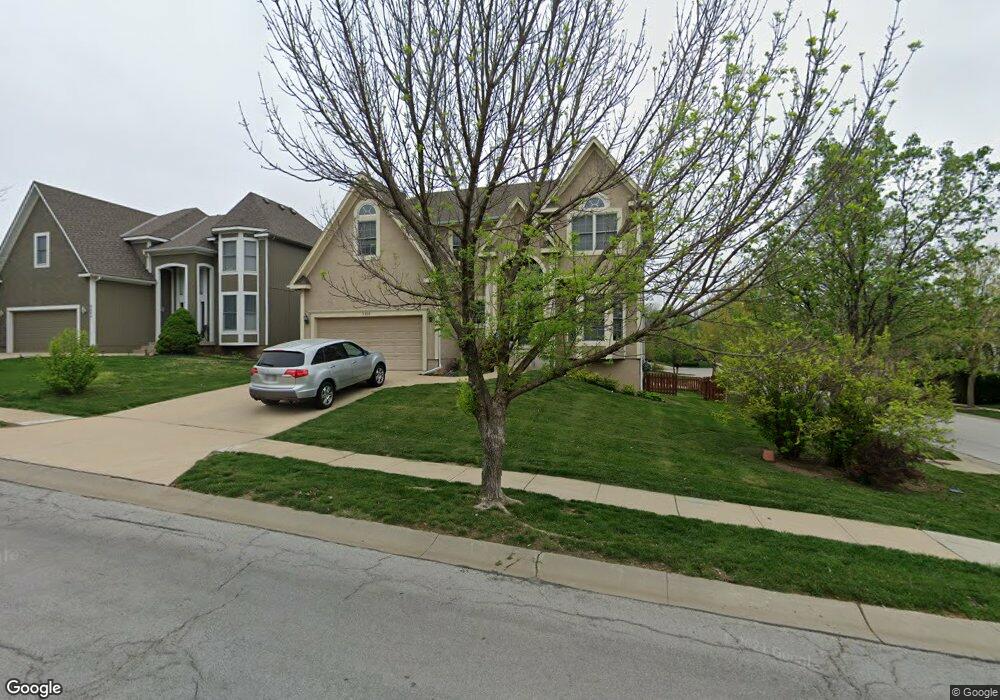
8600 Haven St Lenexa, KS 66219
Estimated Value: $539,000 - $576,000
5
Beds
4
Baths
2,578
Sq Ft
$214/Sq Ft
Est. Value
About This Home
This home is located at 8600 Haven St, Lenexa, KS 66219 and is currently estimated at $550,673, approximately $213 per square foot. 8600 Haven St is a home located in Johnson County with nearby schools including Lenexa Hills Elementary School, Westridge Middle School, and Shawnee Mission West High School.
Ownership History
Date
Name
Owned For
Owner Type
Purchase Details
Closed on
May 10, 2010
Sold by
Song Xiao Jun and Liu Yin Lin
Bought by
Song Xiao Jun
Current Estimated Value
Home Financials for this Owner
Home Financials are based on the most recent Mortgage that was taken out on this home.
Original Mortgage
$187,750
Outstanding Balance
$118,355
Interest Rate
3.87%
Mortgage Type
New Conventional
Estimated Equity
$432,318
Purchase Details
Closed on
Aug 20, 2001
Sold by
Promark Homees Inc
Bought by
Ali Amjad and Ali Elizabeth A
Home Financials for this Owner
Home Financials are based on the most recent Mortgage that was taken out on this home.
Original Mortgage
$243,000
Interest Rate
6.75%
Purchase Details
Closed on
Mar 1, 2001
Sold by
Parkhurst Partners Llc
Bought by
Promark Homes Inc
Home Financials for this Owner
Home Financials are based on the most recent Mortgage that was taken out on this home.
Original Mortgage
$182,500
Interest Rate
7.1%
Create a Home Valuation Report for This Property
The Home Valuation Report is an in-depth analysis detailing your home's value as well as a comparison with similar homes in the area
Home Values in the Area
Average Home Value in this Area
Purchase History
| Date | Buyer | Sale Price | Title Company |
|---|---|---|---|
| Song Xiao Jun | -- | Nations Title | |
| Ali Amjad | -- | Security Land Title Company | |
| Promark Homes Inc | -- | Security Land Title Company |
Source: Public Records
Mortgage History
| Date | Status | Borrower | Loan Amount |
|---|---|---|---|
| Open | Song Xiao Jun | $187,750 | |
| Closed | Ali Amjad | $243,000 | |
| Previous Owner | Promark Homes Inc | $182,500 | |
| Closed | Promark Homes Inc | $37,950 |
Source: Public Records
Tax History Compared to Growth
Tax History
| Year | Tax Paid | Tax Assessment Tax Assessment Total Assessment is a certain percentage of the fair market value that is determined by local assessors to be the total taxable value of land and additions on the property. | Land | Improvement |
|---|---|---|---|---|
| 2024 | $5,852 | $52,797 | $10,234 | $42,563 |
| 2023 | $5,570 | $49,496 | $10,234 | $39,262 |
| 2022 | $4,975 | $44,172 | $7,872 | $36,300 |
| 2021 | $4,625 | $39,008 | $7,491 | $31,517 |
| 2020 | $4,586 | $38,306 | $7,491 | $30,815 |
| 2019 | $4,534 | $37,858 | $6,246 | $31,612 |
| 2018 | $4,396 | $36,375 | $6,246 | $30,129 |
| 2017 | $4,318 | $34,638 | $6,246 | $28,392 |
| 2016 | $4,216 | $33,396 | $6,246 | $27,150 |
| 2015 | $4,272 | $34,098 | $6,246 | $27,852 |
| 2013 | -- | $29,371 | $6,246 | $23,125 |
Source: Public Records
Map
Nearby Homes
- 17821 W 86th St
- 8525 Haven St
- 16809 W 83rd St
- 18245 W 94th St
- 18065 W 94th St
- 9595 Jupiter St
- 9593 Jupiter St
- 9581 Jupiter St
- 9579 Jupiter St
- 9567 Jupiter St
- 9565 Jupiter St
- 9553 Jupiter St
- 9551 Jupiter St
- 9539 Jupiter St
- 9537 Jupiter St
- 16134 W 80th St
- 15710 W 84th Terrace
- 15641 W 83rd Terrace
- 15920 W 91st Terrace
- 17806 W 96th St
- 8604 Haven St
- 17809 W 86th St
- 8550 Haven St
- 17725 W 86th St
- 17813 W 86th St
- 17726 W 86th St
- 8544 Haven St
- 17810 W 86th St
- 17721 W 86th St
- 17817 W 86th St
- 8615 Haven St
- 8549 Haven St
- 17722 W 86th St
- 8619 Haven St
- 8540 Haven St
- 17719 W 86th St
- 17814 W 86th St
- 17718 W 86th St
- 17820 W 86th St
- 8536 Haven St