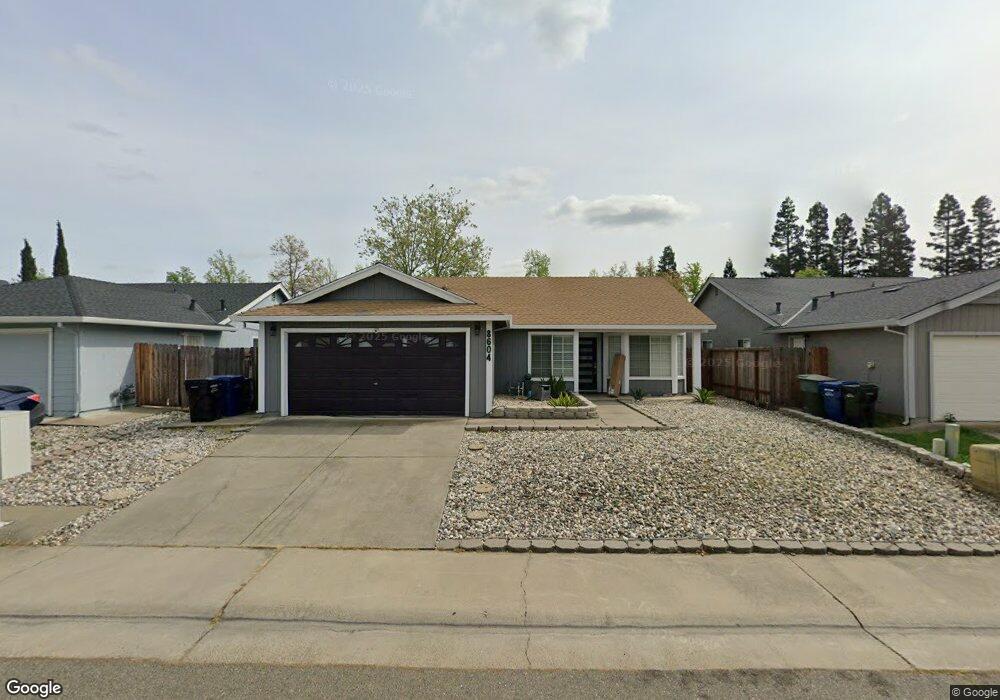
8604 Luciano Ct Sacramento, CA 95828
Estimated Value: $466,000 - $510,000
3
Beds
2
Baths
1,289
Sq Ft
$373/Sq Ft
Est. Value
About This Home
This home is located at 8604 Luciano Ct, Sacramento, CA 95828 and is currently estimated at $480,500, approximately $372 per square foot. 8604 Luciano Ct is a home located in Sacramento County with nearby schools including Isabelle Jackson Elementary School, James Rutter Middle School, and Florin High School.
Ownership History
Date
Name
Owned For
Owner Type
Purchase Details
Closed on
Jan 20, 2005
Sold by
Harman William P
Bought by
Tyler Janelle
Current Estimated Value
Home Financials for this Owner
Home Financials are based on the most recent Mortgage that was taken out on this home.
Original Mortgage
$252,720
Outstanding Balance
$132,205
Interest Rate
6.3%
Mortgage Type
Purchase Money Mortgage
Estimated Equity
$348,295
Purchase Details
Closed on
Nov 18, 1999
Sold by
Woznick Hoang Dai Trang and Woznick Mark
Bought by
Harman William P
Home Financials for this Owner
Home Financials are based on the most recent Mortgage that was taken out on this home.
Original Mortgage
$123,371
Interest Rate
7.82%
Mortgage Type
FHA
Purchase Details
Closed on
Mar 13, 1998
Sold by
Hoang Dai Trang
Bought by
Woznicki Mark and Hoang Dai Trang
Create a Home Valuation Report for This Property
The Home Valuation Report is an in-depth analysis detailing your home's value as well as a comparison with similar homes in the area
Home Values in the Area
Average Home Value in this Area
Purchase History
| Date | Buyer | Sale Price | Title Company |
|---|---|---|---|
| Tyler Janelle | $316,000 | Financial Title Company | |
| Harman William P | $125,000 | Alliance Title Company | |
| Harman William P | -- | Alliance Title Company | |
| Woznicki Mark | -- | -- |
Source: Public Records
Mortgage History
| Date | Status | Borrower | Loan Amount |
|---|---|---|---|
| Open | Tyler Janelle | $252,720 | |
| Previous Owner | Harman William P | $123,371 | |
| Closed | Harman William P | $6,250 | |
| Closed | Tyler Janelle | $63,180 |
Source: Public Records
Tax History Compared to Growth
Tax History
| Year | Tax Paid | Tax Assessment Tax Assessment Total Assessment is a certain percentage of the fair market value that is determined by local assessors to be the total taxable value of land and additions on the property. | Land | Improvement |
|---|---|---|---|---|
| 2025 | $4,743 | $439,061 | $125,443 | $313,618 |
| 2024 | $4,743 | $430,453 | $122,984 | $307,469 |
| 2023 | $4,623 | $422,014 | $120,573 | $301,441 |
| 2022 | $4,544 | $413,740 | $118,209 | $295,531 |
| 2021 | $3,766 | $337,103 | $96,314 | $240,789 |
| 2020 | $3,342 | $298,322 | $85,234 | $213,088 |
| 2019 | $3,138 | $278,806 | $79,658 | $199,148 |
| 2018 | $3,000 | $268,084 | $76,595 | $191,489 |
| 2017 | $2,820 | $250,547 | $71,585 | $178,962 |
| 2016 | $2,543 | $231,989 | $66,283 | $165,706 |
| 2015 | $2,319 | $210,900 | $60,258 | $150,642 |
| 2014 | $2,203 | $198,962 | $56,847 | $142,115 |
Source: Public Records
Map
Nearby Homes
- 8159 Morgan Hill Way
- 8216 Exbourne Cir
- 8233 Short Rd
- 8170 Derbyshire Cir
- 8437 Yermo Way
- 8247 Derbyshire Cir
- 8716 Cord Way
- 8510 Cavendish Way
- 8772 Crusheen Way
- 8447 Cassatt Way
- 8548 Whitby Ct
- 8034 Kelty Ct
- 8578 Hydrangea Ct
- 8336 Cutler Way
- 8836 Inisheer Way
- 8762 Lemas Rd
- 8329 Spengler Dr
- 8831 Liscarney Way
- 8005 Delage Way
- 8317 Honeycomb Way
- 8608 Luciano Ct
- 8600 Luciano Ct
- 8205 Sonoma Hills Way
- 8612 Luciano Ct
- 8201 Sonoma Hills Way
- 8209 Sonoma Hills Way
- 8605 Luciano Ct
- 8601 Luciano Ct
- 8213 Sonoma Hills Way
- 8611 Luciano Ct
- 8616 Luciano Ct
- 8166 Sonoma Hills Way
- 8170 Sonoma Hills Way
- 8174 Sonoma Hills Way
- 8225 Lakespring Way
- 8217 Sonoma Hills Way
- 8615 Luciano Ct
- 8178 Sonoma Hills Way
- 8600 Franzia Ct
- 8221 Lakespring Way