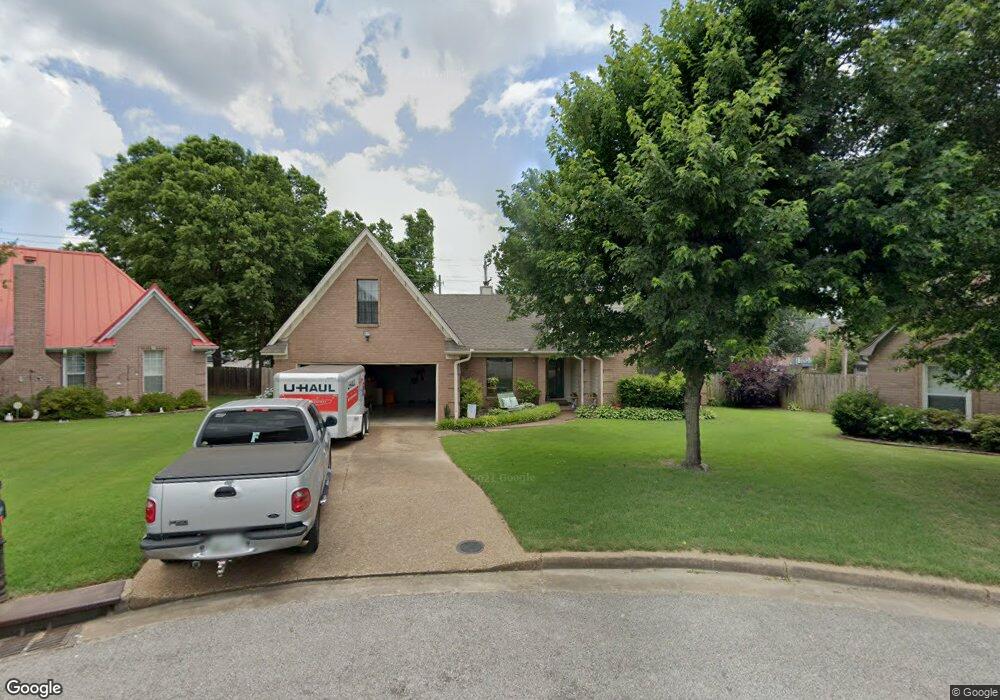
8604 Prism Cove E Cordova, TN 38018
Cordova NeighborhoodEstimated Value: $288,000 - $299,000
3
Beds
2
Baths
2,192
Sq Ft
$134/Sq Ft
Est. Value
About This Home
This home is located at 8604 Prism Cove E, Cordova, TN 38018 and is currently estimated at $294,453, approximately $134 per square foot. 8604 Prism Cove E is a home located in Shelby County with nearby schools including Cordova Elementary School, Cordova High School, and Evangelical Christian School.
Ownership History
Date
Name
Owned For
Owner Type
Purchase Details
Closed on
Mar 30, 2000
Sold by
Phillips Randall J and Phillips Shelly G
Bought by
Campbell Christopher P and Beth Campbell A
Current Estimated Value
Home Financials for this Owner
Home Financials are based on the most recent Mortgage that was taken out on this home.
Original Mortgage
$143,450
Outstanding Balance
$47,871
Interest Rate
8.29%
Estimated Equity
$246,582
Purchase Details
Closed on
Jul 20, 1999
Sold by
Carrico Debra D
Bought by
Phillips Randall J and Phillips Shelly G
Home Financials for this Owner
Home Financials are based on the most recent Mortgage that was taken out on this home.
Original Mortgage
$146,058
Interest Rate
7.51%
Purchase Details
Closed on
Oct 20, 1995
Bought by
Christian John S and Christian Robin R
Create a Home Valuation Report for This Property
The Home Valuation Report is an in-depth analysis detailing your home's value as well as a comparison with similar homes in the area
Home Values in the Area
Average Home Value in this Area
Purchase History
| Date | Buyer | Sale Price | Title Company |
|---|---|---|---|
| Campbell Christopher P | $151,000 | -- | |
| Campbell Christopher P | $151,000 | -- | |
| Phillips Randall J | $142,500 | -- | |
| Phillips Randall J | $142,500 | -- | |
| Christian John S | $111,000 | -- |
Source: Public Records
Mortgage History
| Date | Status | Borrower | Loan Amount |
|---|---|---|---|
| Open | Campbell Christopher P | $143,450 | |
| Closed | Campbell Christopher P | $143,450 | |
| Previous Owner | Phillips Randall J | $146,058 |
Source: Public Records
Tax History Compared to Growth
Tax History
| Year | Tax Paid | Tax Assessment Tax Assessment Total Assessment is a certain percentage of the fair market value that is determined by local assessors to be the total taxable value of land and additions on the property. | Land | Improvement |
|---|---|---|---|---|
| 2025 | $1,734 | $77,875 | $14,750 | $63,125 |
| 2024 | $1,734 | $51,150 | $8,500 | $42,650 |
| 2023 | $3,116 | $51,150 | $8,500 | $42,650 |
| 2022 | $3,116 | $51,150 | $8,500 | $42,650 |
| 2021 | $3,152 | $51,150 | $8,500 | $42,650 |
| 2020 | $2,918 | $40,275 | $8,500 | $31,775 |
| 2019 | $2,918 | $40,275 | $8,500 | $31,775 |
| 2018 | $2,918 | $40,275 | $8,500 | $31,775 |
| 2017 | $1,655 | $40,275 | $8,500 | $31,775 |
| 2016 | $1,471 | $33,650 | $0 | $0 |
| 2014 | $1,471 | $33,650 | $0 | $0 |
Source: Public Records
Map
Nearby Homes
- 8659 Colleton Way
- 8663 Colleton Way
- 8532 Shingle Oaks Dr
- 8667 Colleton Way
- 8664 Eagle View Dr
- 8671 Colleton Way
- 8675 Colleton Way
- 8643 Timber Creek Dr
- 857 Paradise Dr
- 747 Overcup Oaks Cove
- 0 Chelsea Meadow Lot 40 Cove Unit 10005859
- 470 Walnut Point Cove
- 8524 Shady Elm Dr
- 370 Lida Ln
- 485 Heather Leigh Ln
- 8502 Griffin Park Dr
- 8727 Thor Rd
- 970 Bending Pine Ln
- 8301 Weatherwood Ln
- 8570 May Orchard Ln
- 8603 Prism Cove E
- 8600 Prism Cove E
- 671 N Ericson Rd
- 8610 Trinity Rd
- 8596 Prism Cove E
- 8599 Prism Cove E
- 8600 Trinity Rd
- 8595 Prism Cove E
- 8592 Prism Cove E
- 8590 Trinity Rd
- 689 N Ericson Rd
- 8589 Prism Cove E
- 8611 Overcup Oaks Dr
- 686 Radiance Dr
- 8605 Overcup Oaks Dr
- 8580 Trinity Rd
- 670 Radiance Dr
- 8657 Colleton Way Unit 36434831
- 8657 Colleton Way Unit 36455089
- 8657 Colleton Way Unit 36472417