861 2nd Crown Point Rd Strafford, NH 03884
Estimated Value: $505,000 - $578,436
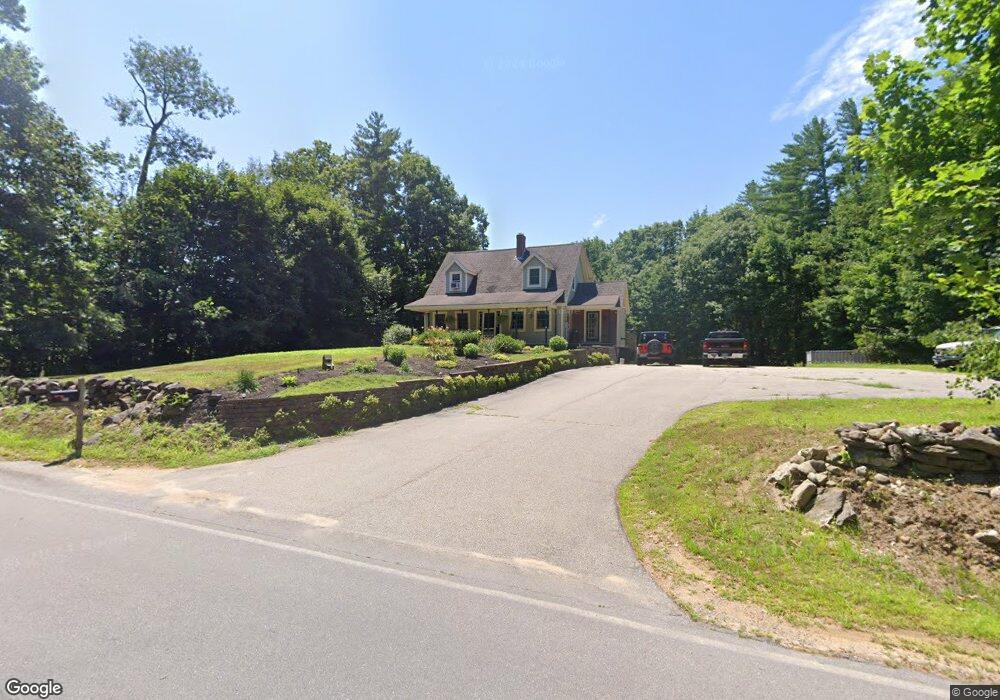
About This Home
This home is located at 861 2nd Crown Point Rd, Strafford, NH 03884 and is currently estimated at $542,359, approximately $321 per square foot. 861 2nd Crown Point Rd is a home located in Strafford County with nearby schools including Strafford School and Coe-Brown Northwood Academy.
Ownership History
We collect this data history from publicly available records. To have your information removed, we recommend requesting removal directly through your county’s website.
Purchase Details
Home Financials for this Owner
Home Financials are based on the most recent Mortgage that was taken out on this home.Purchase Details
Purchase Details
Home Financials for this Owner
Home Financials are based on the most recent Mortgage that was taken out on this home.Home Values in the Area
Average Home Value in this Area
Purchase History
We collect this data history from publicly available records. To have your information removed, we recommend requesting removal directly through your county’s website.
| Date | Buyer | Sale Price | Title Company |
|---|---|---|---|
| $550,000 | None Available | ||
| -- | -- | ||
| $17,000 | -- | ||
| -- | -- | ||
| $17,000 | -- |
Mortgage History
We collect this data history from publicly available records. To have your information removed, we recommend requesting removal directly through your county’s website.
| Date | Status | Borrower | Loan Amount |
|---|---|---|---|
| Open | $440,000 | ||
| Previous Owner | $12,800 |
Tax History
We collect this data history from publicly available records. To have your information removed, we recommend requesting removal directly through your county’s website.
| Year | Tax Paid | Tax Assessment Tax Assessment Total Assessment is a certain percentage of the fair market value that is determined by local assessors to be the total taxable value of land and additions on the property. | Land | Improvement |
|---|---|---|---|---|
| 2024 | $6,665 | $337,300 | $66,000 | $271,300 |
| 2023 | $6,287 | $337,300 | $66,000 | $271,300 |
| 2022 | $5,778 | $337,300 | $66,000 | $271,300 |
| 2021 | $5,968 | $323,300 | $66,000 | $257,300 |
| 2020 | $6,012 | $234,400 | $59,700 | $174,700 |
| 2019 | $5,501 | $234,400 | $59,700 | $174,700 |
| 2018 | $5,508 | $233,100 | $59,700 | $173,400 |
| 2016 | $4,953 | $233,100 | $59,700 | $173,400 |
| 2015 | $5,200 | $238,400 | $73,000 | $165,400 |
| 2014 | $5,521 | $238,400 | $73,000 | $165,400 |
| 2013 | -- | $239,400 | $73,000 | $166,400 |
| 2012 | $5,358 | $239,400 | $73,000 | $166,400 |
Map
- 217 Reservoir Rd
- 435 Second Crown Point Rd
- 16 King Arthur Dr
- 19 King Arthur Dr
- 8 Merlin Rd
- 543 Long Shores Dr
- 322 Long Shores Dr
- 131 Chocorua Way
- 11 Avalon Rd
- 516 Berry River Rd
- 22 Viviana Dr
- Map 104 Berry River Rd
- 184 Pocahontas Ln Unit 184
- 151 Chocorua Way
- 739 Berry River Rd
- 767 Berry River Rd
- 277 Parker Mountain Rd
- M37 L40 Beaver Rd
- 122 Mohegan Dr Unit CCE-34/122
- 18 Treehouse Way
- 111 Cross Rd
- 849 2nd Crown Point Rd
- 849 Second Crown Point Rd
- 103 Cross Rd
- 104 Cross Rd
- 844 Second Crown Point Rd
- 844 2nd Crown Point Rd
- 837 2nd Crown Point Rd
- 119 Cross Rd
- 48-2 Second Crown Point Rd
- 48-1 Second Crown Point Rd
- 825 2nd Crown Point Rd
- 159 Cross Rd
- 77 Cross Rd
- 818 2nd Crown Point Rd
- 905 2nd Crown Point Rd
- 905 2nd Crown Point Rd
- 0 Bailey Dr
- 22 Bailey Dr
- 67 Cross Rd
Ask me questions while you tour the home.