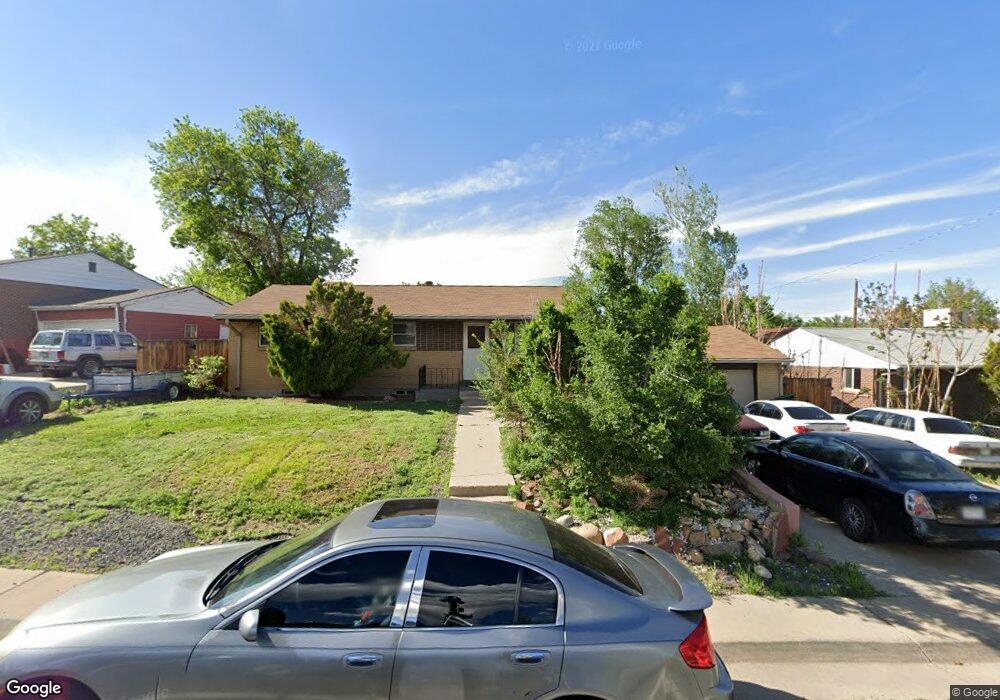
861 Del Norte St Denver, CO 80221
Sherrelwood NeighborhoodEstimated Value: $439,000 - $486,000
4
Beds
2
Baths
2,000
Sq Ft
$232/Sq Ft
Est. Value
About This Home
This home is located at 861 Del Norte St, Denver, CO 80221 and is currently estimated at $463,554, approximately $231 per square foot. 861 Del Norte St is a home located in Adams County with nearby schools including Sherrelwood Elementary School, Iver C. Ranum Middle School, and Westminster High School.
Ownership History
Date
Name
Owned For
Owner Type
Purchase Details
Closed on
Jun 28, 2017
Sold by
Chavez Jerardo Jose
Bought by
Cortez Bobby
Current Estimated Value
Home Financials for this Owner
Home Financials are based on the most recent Mortgage that was taken out on this home.
Original Mortgage
$314,204
Outstanding Balance
$260,907
Interest Rate
3.87%
Mortgage Type
FHA
Estimated Equity
$202,647
Purchase Details
Closed on
Aug 11, 1999
Sold by
Alexander Michael L
Bought by
Alexander Michael L and Berglund Patricia J
Purchase Details
Closed on
Apr 16, 1997
Sold by
Basing Rickey L and Basing Diane L
Bought by
Chavez Jerardo Jose
Home Financials for this Owner
Home Financials are based on the most recent Mortgage that was taken out on this home.
Original Mortgage
$118,320
Interest Rate
7.82%
Mortgage Type
VA
Purchase Details
Closed on
Sep 3, 1993
Sold by
Leon Russell A
Bought by
Basing Rickey L and Basing Diane L
Create a Home Valuation Report for This Property
The Home Valuation Report is an in-depth analysis detailing your home's value as well as a comparison with similar homes in the area
Home Values in the Area
Average Home Value in this Area
Purchase History
| Date | Buyer | Sale Price | Title Company |
|---|---|---|---|
| Cortez Bobby | $320,000 | Land Title Guarantee Co | |
| Alexander Michael L | -- | -- | |
| Chavez Jerardo Jose | $116,000 | First American Heritage Titl | |
| Basing Rickey L | $84,000 | -- |
Source: Public Records
Mortgage History
| Date | Status | Borrower | Loan Amount |
|---|---|---|---|
| Open | Cortez Bobby | $314,204 | |
| Previous Owner | Chavez Jerardo Jose | $118,320 |
Source: Public Records
Tax History Compared to Growth
Tax History
| Year | Tax Paid | Tax Assessment Tax Assessment Total Assessment is a certain percentage of the fair market value that is determined by local assessors to be the total taxable value of land and additions on the property. | Land | Improvement |
|---|---|---|---|---|
| 2024 | $3,245 | $27,570 | $5,630 | $21,940 |
| 2023 | $3,140 | $31,660 | $5,610 | $26,050 |
| 2022 | $2,831 | $23,780 | $5,770 | $18,010 |
| 2021 | $2,894 | $23,780 | $5,770 | $18,010 |
| 2020 | $2,787 | $23,310 | $5,930 | $17,380 |
| 2019 | $2,780 | $23,310 | $5,930 | $17,380 |
| 2018 | $2,255 | $18,800 | $5,620 | $13,180 |
| 2017 | $1,970 | $18,800 | $5,620 | $13,180 |
| 2016 | $1,553 | $14,060 | $3,100 | $10,960 |
| 2015 | $1,551 | $14,060 | $3,100 | $10,960 |
| 2014 | -- | $11,700 | $2,310 | $9,390 |
Source: Public Records
Map
Nearby Homes
- 881 Del Norte St
- 841 Del Norte St
- 860 Delta St
- 840 Delta St
- 901 Del Norte St
- 821 Del Norte St
- 840 Del Norte St
- 860 Del Norte St
- 880 Delta St
- 880 Del Norte St
- 820 Del Norte St
- 830 Delta St
- 0 Tbd County Road 21
- 921 Del Norte St
- 781 Del Norte St
- 900 Del Norte St
- 790 Del Norte St
- 900 Delta St
- 820 Delta St
- 920 Del Norte St