C
Seller's Agent in 2025
Charles Medalie
ListWithFreedom.com
(855) 456-4945
2 in this area
412 Total Sales
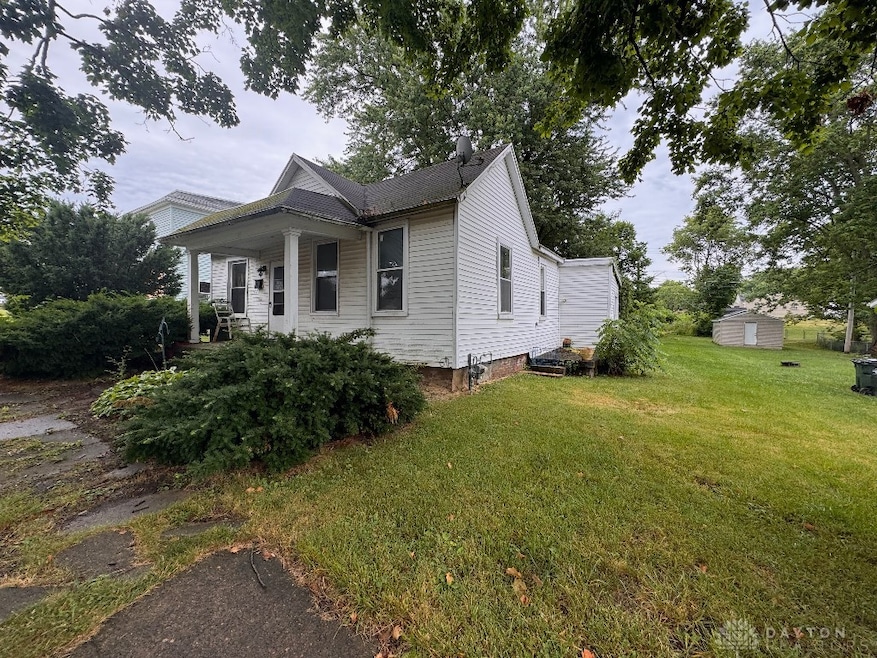
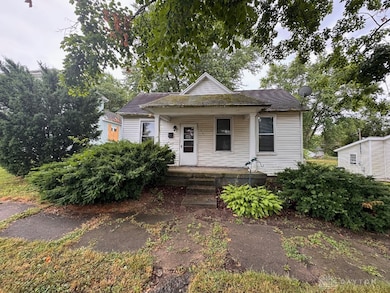
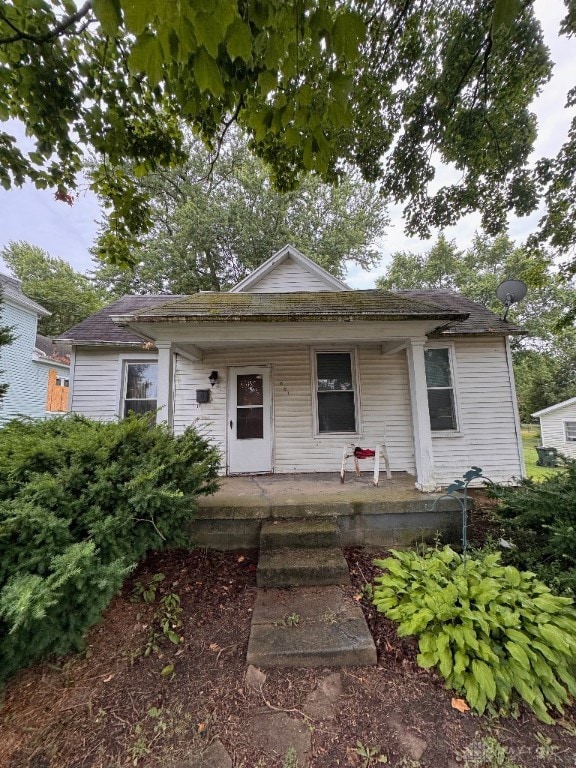
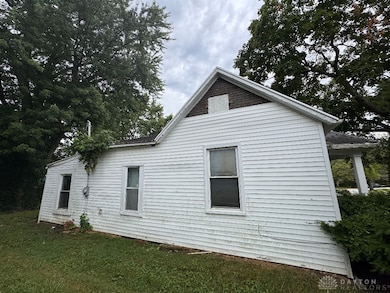
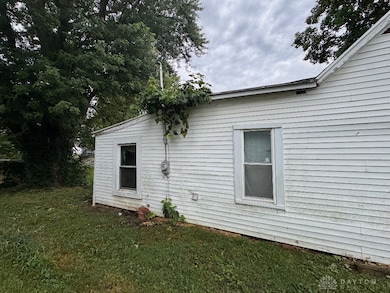
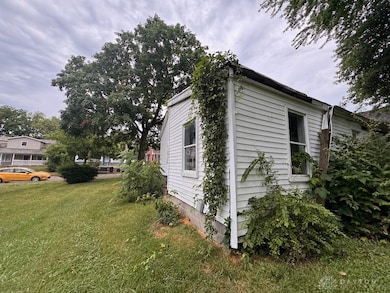
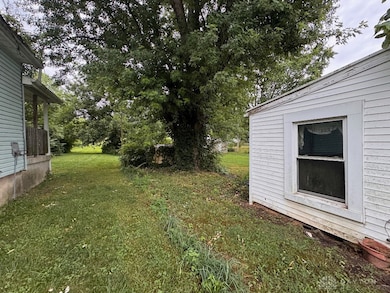
3bd / 1ba house offers prime flip potential in the heart of Xenia with major upside for the right investor. Sitting on a large lot with plenty of living space, this project is in need of a full rehab and a little TLC. A true blank canvas for value-add flippers or BRRRR investors looking for equity in a rising market. Motivated seller. Sold as-is Property Details:
-Centrally located near downtown Xenia, public parks, and retail
-Residential street with mature trees and established neighboring homes
-Large lot offers potential for expansion or outdoor upgrades
Last Agent to Sell the Property
ListWithFreedom.com Brokerage Phone: (855) 456-4945 License #2020001410 Listed on: 07/05/2025
Last Buyer's Agent
Test Member
Test Office
| Date | Type | Sale Price | Title Company |
|---|---|---|---|
| Warranty Deed | $48,000 | None Listed On Document | |
| Quit Claim Deed | $134,138 | None Listed On Document | |
| Sheriffs Deed | $27,000 | None Listed On Document | |
| Interfamily Deed Transfer | -- | -- | |
| Quit Claim Deed | -- | -- | |
| Fiduciary Deed | $10,000 | -- |
| Date | Event | Price | List to Sale | Price per Sq Ft |
|---|---|---|---|---|
| 10/29/2025 10/29/25 | Sold | $48,000 | -28.0% | $41 / Sq Ft |
| 10/14/2025 10/14/25 | Pending | -- | -- | -- |
| 08/12/2025 08/12/25 | Price Changed | $66,700 | -1.5% | $58 / Sq Ft |
| 07/05/2025 07/05/25 | For Sale | $67,700 | -- | $58 / Sq Ft |
| Year | Tax Paid | Tax Assessment Tax Assessment Total Assessment is a certain percentage of the fair market value that is determined by local assessors to be the total taxable value of land and additions on the property. | Land | Improvement |
|---|---|---|---|---|
| 2024 | $578 | $13,610 | $2,520 | $11,090 |
| 2023 | $578 | $13,610 | $2,520 | $11,090 |
| 2022 | $487 | $9,960 | $2,290 | $7,670 |
| 2021 | $494 | $9,960 | $2,290 | $7,670 |
| 2020 | $472 | $9,960 | $2,290 | $7,670 |
| 2019 | $446 | $8,850 | $2,370 | $6,480 |
| 2018 | $448 | $8,850 | $2,370 | $6,480 |
| 2017 | $5,650 | $8,850 | $2,370 | $6,480 |
| 2016 | $575 | $8,550 | $2,370 | $6,180 |
| 2015 | $677 | $8,550 | $2,370 | $6,180 |
| 2014 | $423 | $8,550 | $2,370 | $6,180 |
C
Seller's Agent in 2025
Charles Medalie
ListWithFreedom.com
(855) 456-4945
2 in this area
412 Total Sales
T
Buyer's Agent in 2025
Test Member
DABR
Source: Dayton REALTORS®
MLS Number: 938292
APN: M40-0002-0008-0-0395-00
Disclaimer: Certain information contained herein is derived from information provided by parties other than Homes.com. All information provided is deemed reliable, but is not guaranteed to be accurate and should be independently verified.
![]() The information is being provided by Dayton Area Board of Realtors MLS. Information deemed reliable but not guaranteed. Information is provided for the consumer's personal, non-commercial use, and may not be used for any purpose other than the identification of potential properties for purchase. Copyright 2025 Dayton Area Board of Realtors MLS. All Rights Reserved.
The information is being provided by Dayton Area Board of Realtors MLS. Information deemed reliable but not guaranteed. Information is provided for the consumer's personal, non-commercial use, and may not be used for any purpose other than the identification of potential properties for purchase. Copyright 2025 Dayton Area Board of Realtors MLS. All Rights Reserved.
