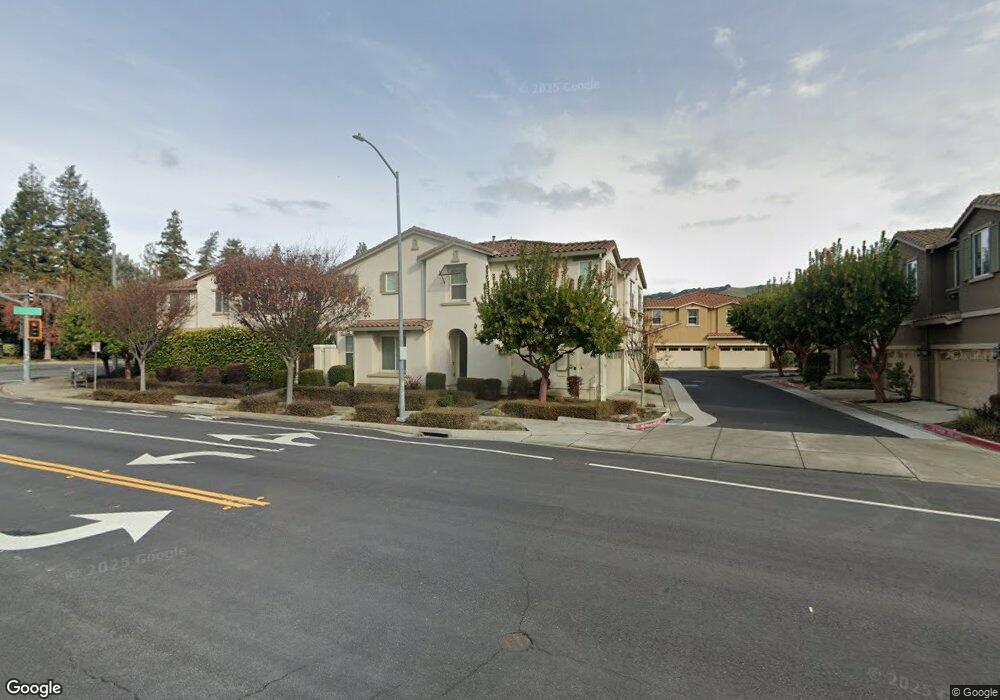
861 Gary Lee King Common Fremont, CA 94536
Cherry-Guardino NeighborhoodEstimated Value: $1,367,000 - $1,578,000
3
Beds
2
Baths
1,483
Sq Ft
$1,000/Sq Ft
Est. Value
About This Home
This home is located at 861 Gary Lee King Common, Fremont, CA 94536 and is currently estimated at $1,482,344, approximately $999 per square foot. 861 Gary Lee King Common is a home located in Alameda County with nearby schools including Vallejo Mill Elementary School, Centerville Junior High School, and Washington High School.
Ownership History
Date
Name
Owned For
Owner Type
Purchase Details
Closed on
Apr 17, 2018
Sold by
Santos Alex C and Santos Violeta M
Bought by
Khiabani Yahya Sowti and Najjari Roghaiyeh
Current Estimated Value
Home Financials for this Owner
Home Financials are based on the most recent Mortgage that was taken out on this home.
Original Mortgage
$789,600
Outstanding Balance
$677,935
Interest Rate
4.37%
Mortgage Type
Adjustable Rate Mortgage/ARM
Estimated Equity
$804,409
Purchase Details
Closed on
Jan 4, 2013
Sold by
Lennar Homes Of California Inc
Bought by
Santos Alex C and Santos Violeta M
Home Financials for this Owner
Home Financials are based on the most recent Mortgage that was taken out on this home.
Original Mortgage
$583,926
Interest Rate
3.25%
Mortgage Type
FHA
Create a Home Valuation Report for This Property
The Home Valuation Report is an in-depth analysis detailing your home's value as well as a comparison with similar homes in the area
Home Values in the Area
Average Home Value in this Area
Purchase History
| Date | Buyer | Sale Price | Title Company |
|---|---|---|---|
| Khiabani Yahya Sowti | $987,000 | Fidelity National Title Comp | |
| Santos Alex C | $595,000 | North American Title Company |
Source: Public Records
Mortgage History
| Date | Status | Borrower | Loan Amount |
|---|---|---|---|
| Open | Khiabani Yahya Sowti | $789,600 | |
| Previous Owner | Santos Alex C | $583,926 |
Source: Public Records
Tax History Compared to Growth
Tax History
| Year | Tax Paid | Tax Assessment Tax Assessment Total Assessment is a certain percentage of the fair market value that is determined by local assessors to be the total taxable value of land and additions on the property. | Land | Improvement |
|---|---|---|---|---|
| 2025 | $13,213 | $1,116,018 | $341,343 | $781,675 |
| 2024 | $13,213 | $1,093,998 | $334,650 | $766,348 |
| 2023 | $12,866 | $1,079,412 | $328,089 | $751,323 |
| 2022 | $12,710 | $1,051,251 | $321,657 | $736,594 |
| 2021 | $12,394 | $1,030,504 | $315,351 | $722,153 |
| 2020 | $12,463 | $1,026,874 | $312,120 | $714,754 |
| 2019 | $12,319 | $1,006,740 | $306,000 | $700,740 |
| 2018 | $8,140 | $643,505 | $193,073 | $450,432 |
| 2017 | $7,937 | $630,887 | $189,287 | $441,600 |
| 2016 | $7,801 | $618,520 | $185,577 | $432,943 |
| 2015 | $7,696 | $609,232 | $182,790 | $426,442 |
| 2014 | $7,554 | $597,298 | $179,209 | $418,089 |
Source: Public Records
Map
Nearby Homes
- 38538 Tyson Ln
- 38623 Cherry Ln Unit 148
- 38623 Cherry Ln Unit 175
- 38623 Cherry Ln Unit 201
- 38623 Cherry Ln Unit 203
- 38627 Cherry Ln Unit 71
- 1145 Bennett Ct
- 38521 Royal Ann Common
- 38780 Tyson Ln Unit 305C
- 38780 Tyson Ln Unit 205C
- 38697 Huntington Cir
- 38721 Cherry Ln
- 38784 Huntington Cir
- 957 Huntington Common
- 952 Cherry Glen Terrace
- 38851 Stillwater Common
- 1225 Koi Terrace
- 874 Cherry Glen Cir Unit 111
- 38605 Vancouver Common
- 111 Overacker Terrace
- 38507 Gary Lee King Terrace
- 859 Gary Lee King Common
- 0 Gary Lee King Terrace
- 862 Gary Lee King Common
- 860 Gary Lee King Common
- 858 Gary Lee King Common
- 38503 Gary Lee King Terrace
- 101 Guardino Dr
- 856 Gary Lee King Common
- 38501 Gary Lee King Terrace
- 38508 Gary Lee King Terrace
- 38506 Gary Lee King Terrace
- 38504 Gary Lee King Terrace
- 38510 Gary Lee King Terrace
- 38502 Gary Lee King Terrace
- 38700 Chimaera Cir
- 38512 Gary Lee King Terrace
- 38702 Chimaera Cir
- 801 Neon Terrace
- 38500 Gary Lee King Terrace