Estimated Value: $810,000 - $929,000
4
Beds
3
Baths
1,684
Sq Ft
$506/Sq Ft
Est. Value
About This Home
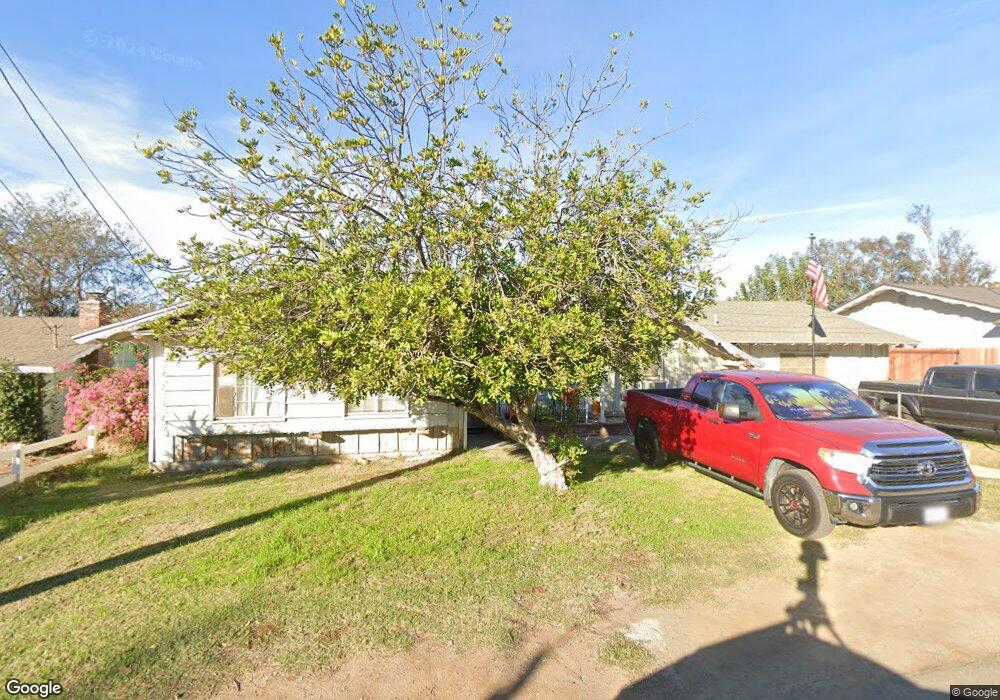
This home is located at 861 Hillside Ln, Norco, CA 92860 and is currently estimated at $851,864, approximately $505 per square foot. 861 Hillside Ln is a home located in Riverside County with nearby schools including Sierra Vista Elementary School, Norco Intermediate School, and Norco High School.
Ownership History
Date
Name
Owned For
Owner Type
Purchase Details
Closed on
Oct 9, 2024
Sold by
Nitso Marlin Leonard
Bought by
Nitso Marlin Leonard and Nitso Debra
Current Estimated Value
Home Financials for this Owner
Home Financials are based on the most recent Mortgage that was taken out on this home.
Original Mortgage
$1,230,000
Outstanding Balance
$1,229,392
Interest Rate
6.32%
Mortgage Type
Reverse Mortgage Home Equity Conversion Mortgage
Estimated Equity
-$377,528
Purchase Details
Closed on
Dec 18, 2019
Sold by
Nitso Marlin Leonard and Nitso Marlin L
Bought by
Nitso Marlin Leonard
Home Financials for this Owner
Home Financials are based on the most recent Mortgage that was taken out on this home.
Original Mortgage
$100,000
Interest Rate
3.6%
Mortgage Type
New Conventional
Purchase Details
Closed on
Jul 11, 2016
Sold by
Nitso Debra Ann
Bought by
Nitso Marlin L
Purchase Details
Closed on
Jun 18, 2014
Sold by
Nitso Carol A
Bought by
Nitso Marlin L
Create a Home Valuation Report for This Property
The Home Valuation Report is an in-depth analysis detailing your home's value as well as a comparison with similar homes in the area
Home Values in the Area
Average Home Value in this Area
Purchase History
| Date | Buyer | Sale Price | Title Company |
|---|---|---|---|
| Nitso Marlin Leonard | -- | None Listed On Document | |
| Nitso Marlin | -- | None Listed On Document | |
| Nitso Marlin Leonard | -- | First American Title Company | |
| Nitso Marlin L | -- | Lawyers Title | |
| Nitso Marlin L | -- | None Available |
Source: Public Records
Mortgage History
| Date | Status | Borrower | Loan Amount |
|---|---|---|---|
| Open | Nitso Marlin | $1,230,000 | |
| Closed | Nitso Marlin Leonard | $1,230,000 | |
| Previous Owner | Nitso Marlin Leonard | $100,000 |
Source: Public Records
Tax History
| Year | Tax Paid | Tax Assessment Tax Assessment Total Assessment is a certain percentage of the fair market value that is determined by local assessors to be the total taxable value of land and additions on the property. | Land | Improvement |
|---|---|---|---|---|
| 2025 | $2,895 | $271,018 | $86,111 | $184,907 |
| 2023 | $2,895 | $260,496 | $82,769 | $177,727 |
| 2022 | $2,800 | $255,390 | $81,147 | $174,243 |
| 2021 | $2,743 | $250,383 | $79,556 | $170,827 |
| 2020 | $2,712 | $247,817 | $78,741 | $169,076 |
| 2019 | $2,647 | $242,959 | $77,198 | $165,761 |
| 2018 | $2,585 | $238,196 | $75,685 | $162,511 |
| 2017 | $2,519 | $233,526 | $74,201 | $159,325 |
| 2016 | $2,492 | $228,948 | $72,747 | $156,201 |
| 2015 | $2,451 | $406,971 | $122,397 | $284,574 |
| 2014 | $2,420 | $221,091 | $70,250 | $150,841 |
Source: Public Records
Map
Nearby Homes
- 891 La Quinta Way
- 989 3rd St
- 640 Vaughan St
- 3004 Dapplegray Ln
- 2353 Corona Ave
- 2320 Temescal Ave
- 2160 Temescal Ave
- 2036 Temescal Ave
- 1826 Hillside Ave
- 3470 Pedley Ave
- 0 Daugherty Rd
- 3149 Sierra Ave
- 3563 Pedley Ave
- 1642 4th St
- 2655 Hamner Ave
- 3757 Corona Ave
- 1951 Valley View Ave
- 3700 California Ave
- 866 Sixth St
- 221 East St
- 851 Hillside Ln
- 841 Hillside Ln
- 2624 Hillside Ave
- 891 Hillside Ln
- 2636 Hillside Ave
- 838 Kingman Dr
- 872 Kingman Dr
- 901 Hillside Ln
- 874 Kingman Dr
- 2675 Hillside Ave
- 2714 Hillside Ave
- 2594 Hillside Ave
- 876 Kingman Dr
- 911 Hillside Ln
- 160 Kingman Dr
- 890 Kingman Dr
- 849 Kingman Dr
- 847 Kingman Dr
- 2570 Hillside Ave
- 845 Kingman Dr
Your Personal Tour Guide
Ask me questions while you tour the home.