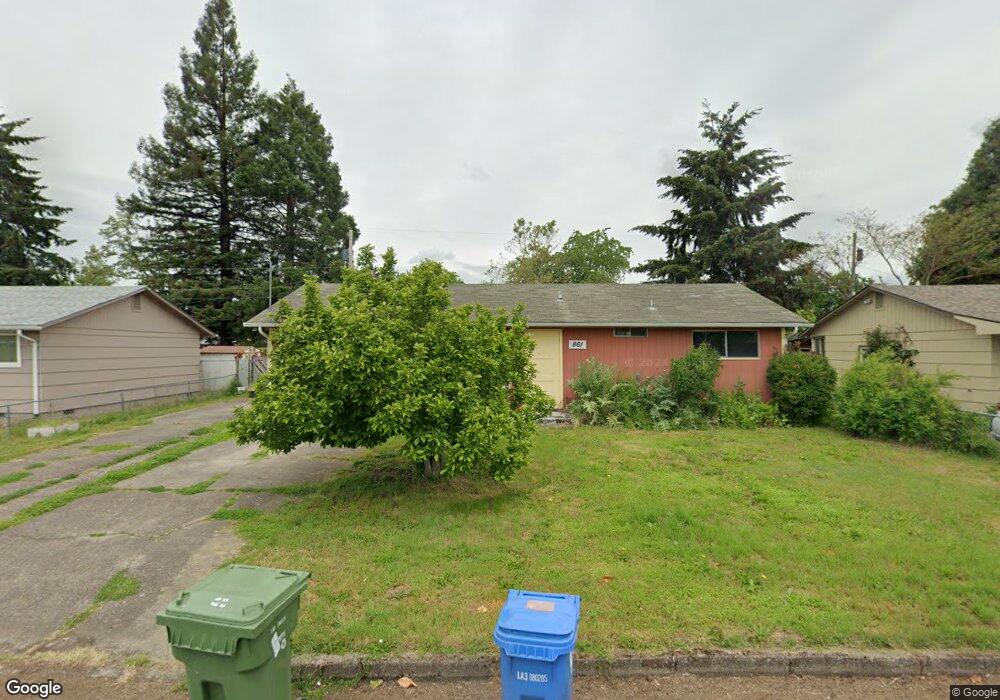
861 Ivy Ave Eugene, OR 97404
River Road NeighborhoodEstimated Value: $332,000 - $355,000
3
Beds
1
Bath
1,056
Sq Ft
$325/Sq Ft
Est. Value
About This Home
This home is located at 861 Ivy Ave, Eugene, OR 97404 and is currently estimated at $343,225, approximately $325 per square foot. 861 Ivy Ave is a home located in Lane County with nearby schools including Howard Elementary School, Kelly Middle School, and North Eugene High School.
Ownership History
Date
Name
Owned For
Owner Type
Purchase Details
Closed on
Jan 14, 2012
Sold by
Cox Leanna
Bought by
Cox Larry
Current Estimated Value
Purchase Details
Closed on
Oct 25, 2006
Sold by
Emmons Michelle M
Bought by
Cox Larry D and Cox Leanna
Home Financials for this Owner
Home Financials are based on the most recent Mortgage that was taken out on this home.
Original Mortgage
$180,000
Outstanding Balance
$106,438
Interest Rate
6.39%
Mortgage Type
Purchase Money Mortgage
Estimated Equity
$236,787
Purchase Details
Closed on
Jun 19, 2002
Sold by
Dedmore Kathryn Sue
Bought by
Emmons Michelle M
Home Financials for this Owner
Home Financials are based on the most recent Mortgage that was taken out on this home.
Original Mortgage
$101,850
Interest Rate
6.74%
Create a Home Valuation Report for This Property
The Home Valuation Report is an in-depth analysis detailing your home's value as well as a comparison with similar homes in the area
Home Values in the Area
Average Home Value in this Area
Purchase History
| Date | Buyer | Sale Price | Title Company |
|---|---|---|---|
| Cox Larry | -- | None Available | |
| Cox Larry D | $180,000 | Western Title & Escrow Compa | |
| Emmons Michelle M | $105,000 | Fidelity National Title Ins |
Source: Public Records
Mortgage History
| Date | Status | Borrower | Loan Amount |
|---|---|---|---|
| Open | Cox Larry D | $180,000 | |
| Previous Owner | Emmons Michelle M | $101,850 |
Source: Public Records
Tax History
| Year | Tax Paid | Tax Assessment Tax Assessment Total Assessment is a certain percentage of the fair market value that is determined by local assessors to be the total taxable value of land and additions on the property. | Land | Improvement |
|---|---|---|---|---|
| 2025 | $2,266 | $138,804 | -- | -- |
| 2024 | $2,243 | $134,762 | -- | -- |
| 2023 | $2,243 | $130,837 | $0 | $0 |
| 2022 | $2,109 | $127,027 | $0 | $0 |
| 2021 | $1,959 | $123,328 | $0 | $0 |
| 2020 | $1,975 | $119,736 | $0 | $0 |
| 2019 | $1,905 | $116,249 | $0 | $0 |
| 2018 | $1,775 | $109,577 | $0 | $0 |
| 2017 | $1,709 | $109,577 | $0 | $0 |
| 2016 | $1,629 | $106,385 | $0 | $0 |
| 2015 | $1,571 | $103,286 | $0 | $0 |
| 2014 | $1,520 | $100,278 | $0 | $0 |
Source: Public Records
Map
Nearby Homes
- 2563 York St
- 303 Lenore Loop
- 2568 Dover Dr
- 401 Sterling Dr
- 1682 Hemlock St
- 1384 David Ave
- 193 Santa Clara Ave
- 349 Irving Rd
- 2740 Stark St
- 2488 Northampton
- 1880 Manihi Dr
- 200 Irving Rd
- 2785 Alyndale Dr
- 1725 Allea Dr
- 2795 Kalmia St
- 389 Maxwell Rd
- 2937 Stark St
- 2484 Crowther Dr
- 1410 Lake Dr
- 2989 Dahlia Ln
Your Personal Tour Guide
Ask me questions while you tour the home.